
Our Services
We support organisations that want to use Open Data but lack the resources or expertise to do so effectively.
Services are available to non-profits and public interest organisations at reduced or no cost — funded through membership and donations.
Data Engineering
-
Data collection and cleaning
Gather raw data from public sources and transform it into structured, usable formats. -
Data integration and pipelines
Connect multiple data sources and automate workflows for reliable, up-to-date data. -
Structuring Open Data for reuse
Organise and document datasets so they are easy to access, understand, and build upon.
Data Storytelling
-
Visualisations and dashboards
Turn data into clear charts, maps, and interactive dashboards that communicate your story. -
Communicating insights clearly
Translate complex findings into plain language narratives for any audience. -
Making data understandable for non-experts
Design accessible outputs that anyone can read, explore, and act on.
♥ Interested in our services? Get in touch — we are happy to discuss how we can help.
Examples of Data Services
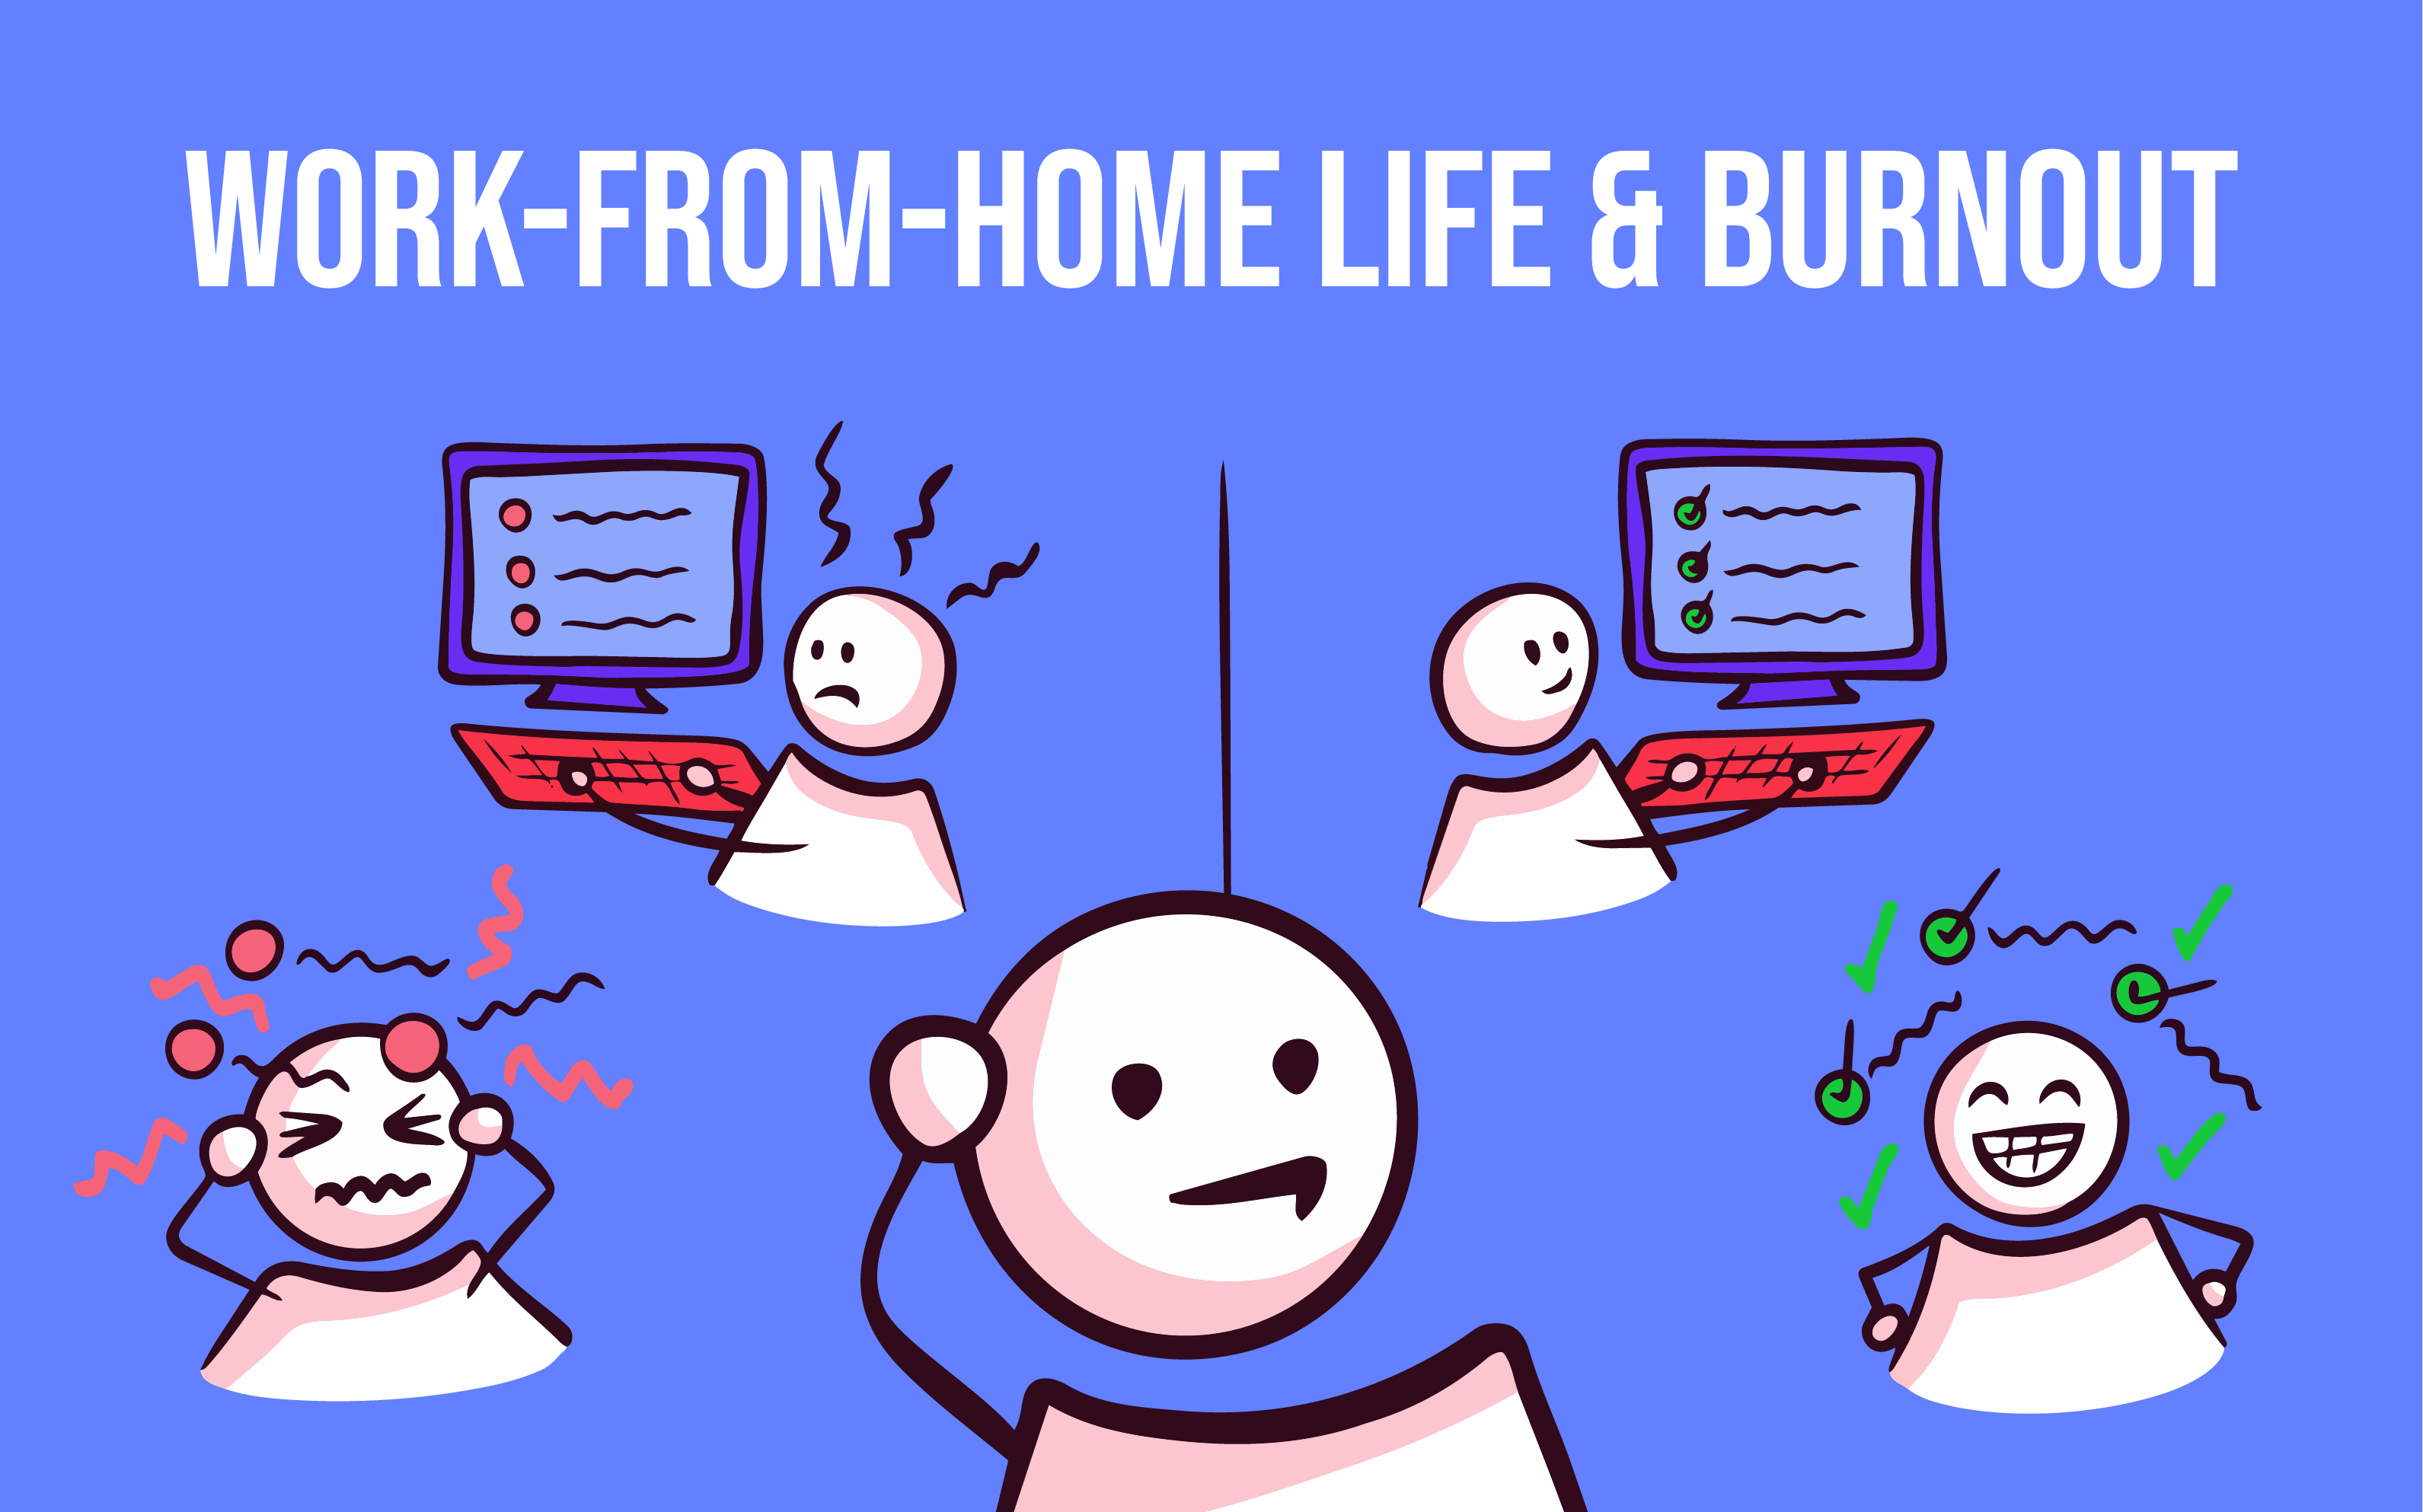
Working-from-home life & Burnout
This data story visualization explores the reasons of a burnout in the context of working-from-home life. It is based on a dataset with 1600 samples.
And the findings? 🤔 They are not what you might expect.
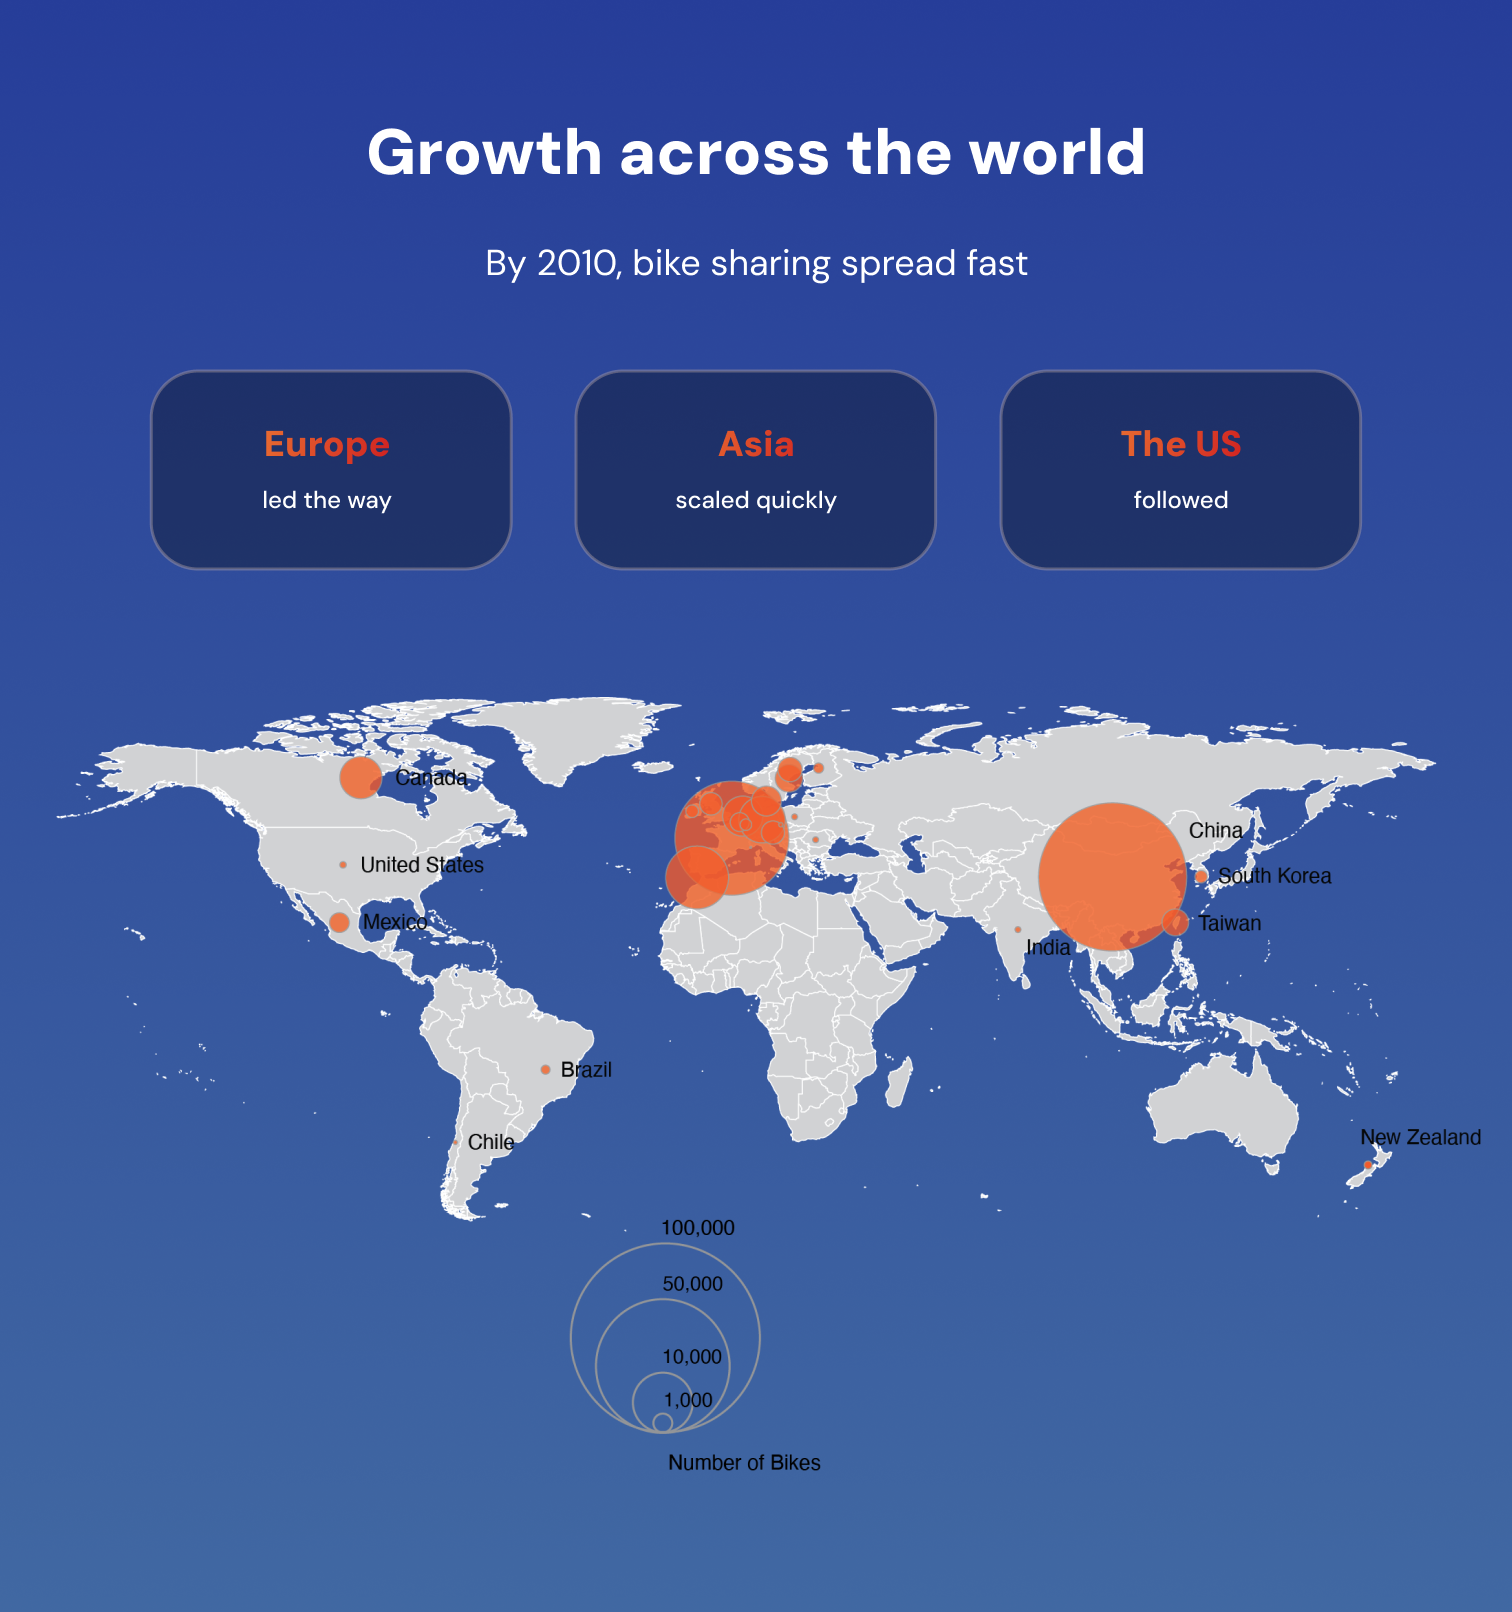
Bike Share & Sustainable Mobility
This data story visualization explores the role of bike sharing in sustainable urban mobility. It combines open transportation and environmental data to reveal how bike share systems influence travel patterns and emissions.
And the impact? 🚲 It might reshape how we think about moving through our cities.
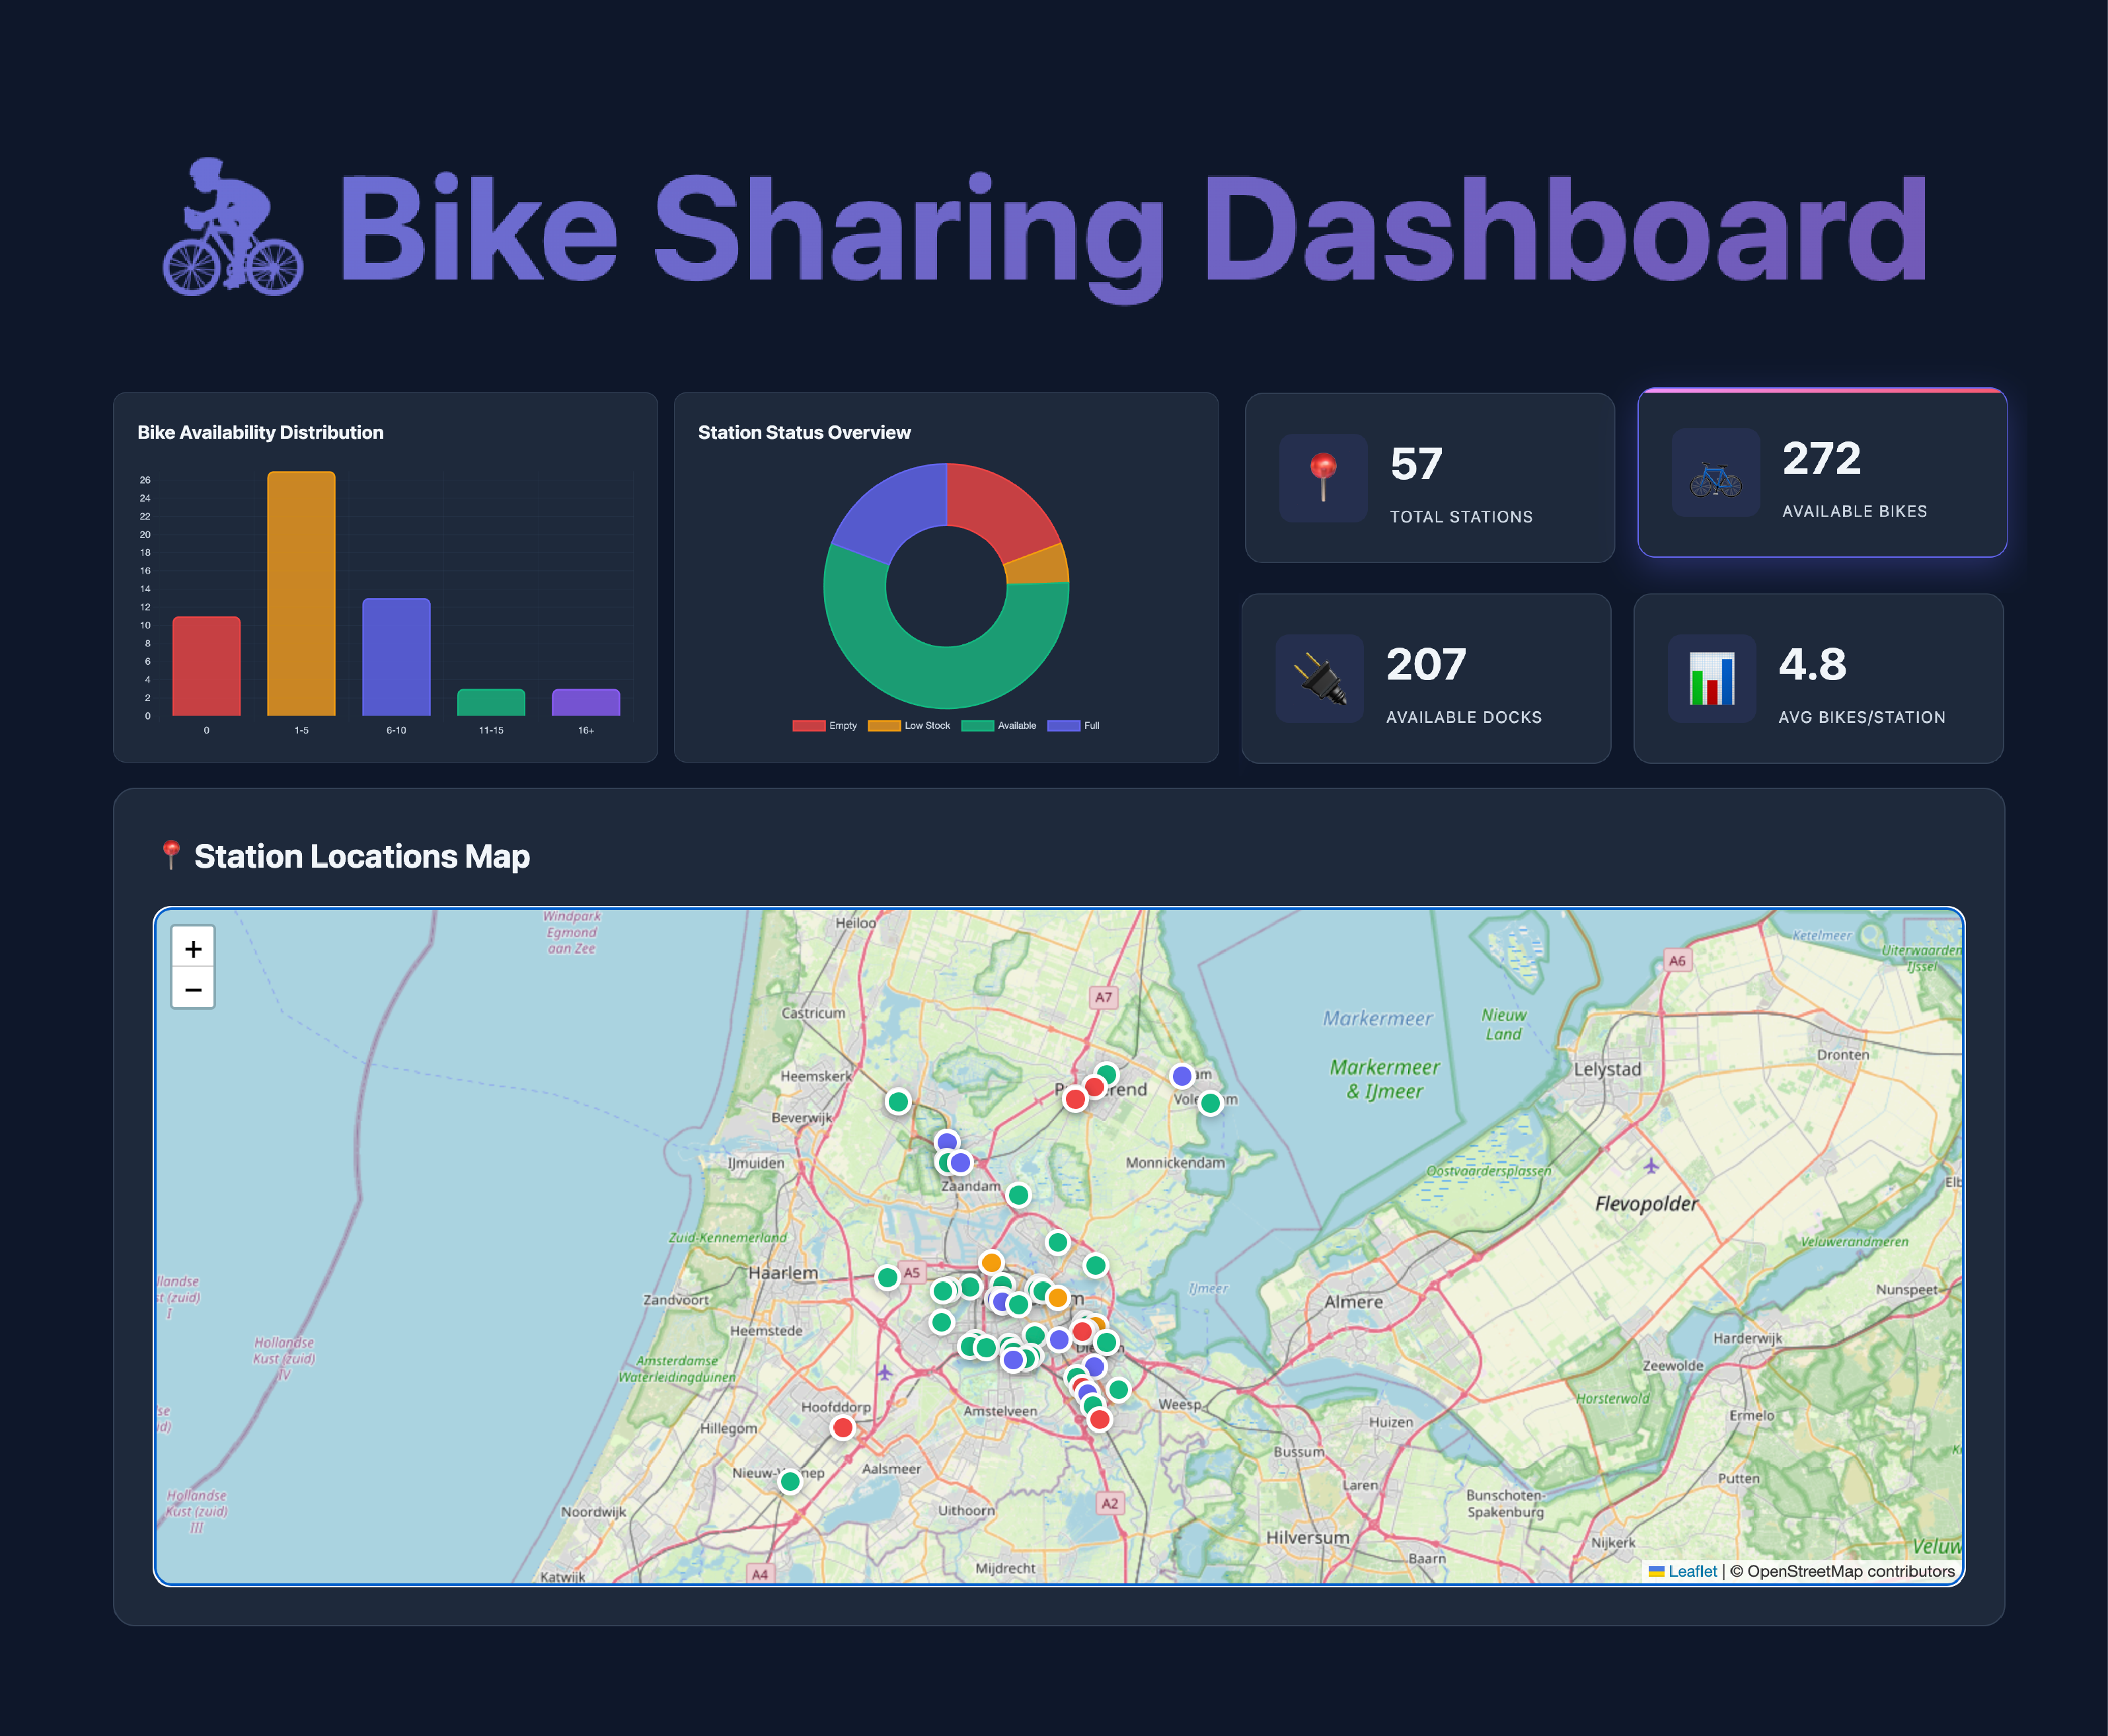
Bike Rental Dashboard & Live Data
This data dashboard visualizes the locations of bike rental stations and the number of available bikes at each one. It is powered by a live data feed, providing an up-to-date snapshot of bike availability across the city.
And the insights? 🚲 They update in real time.
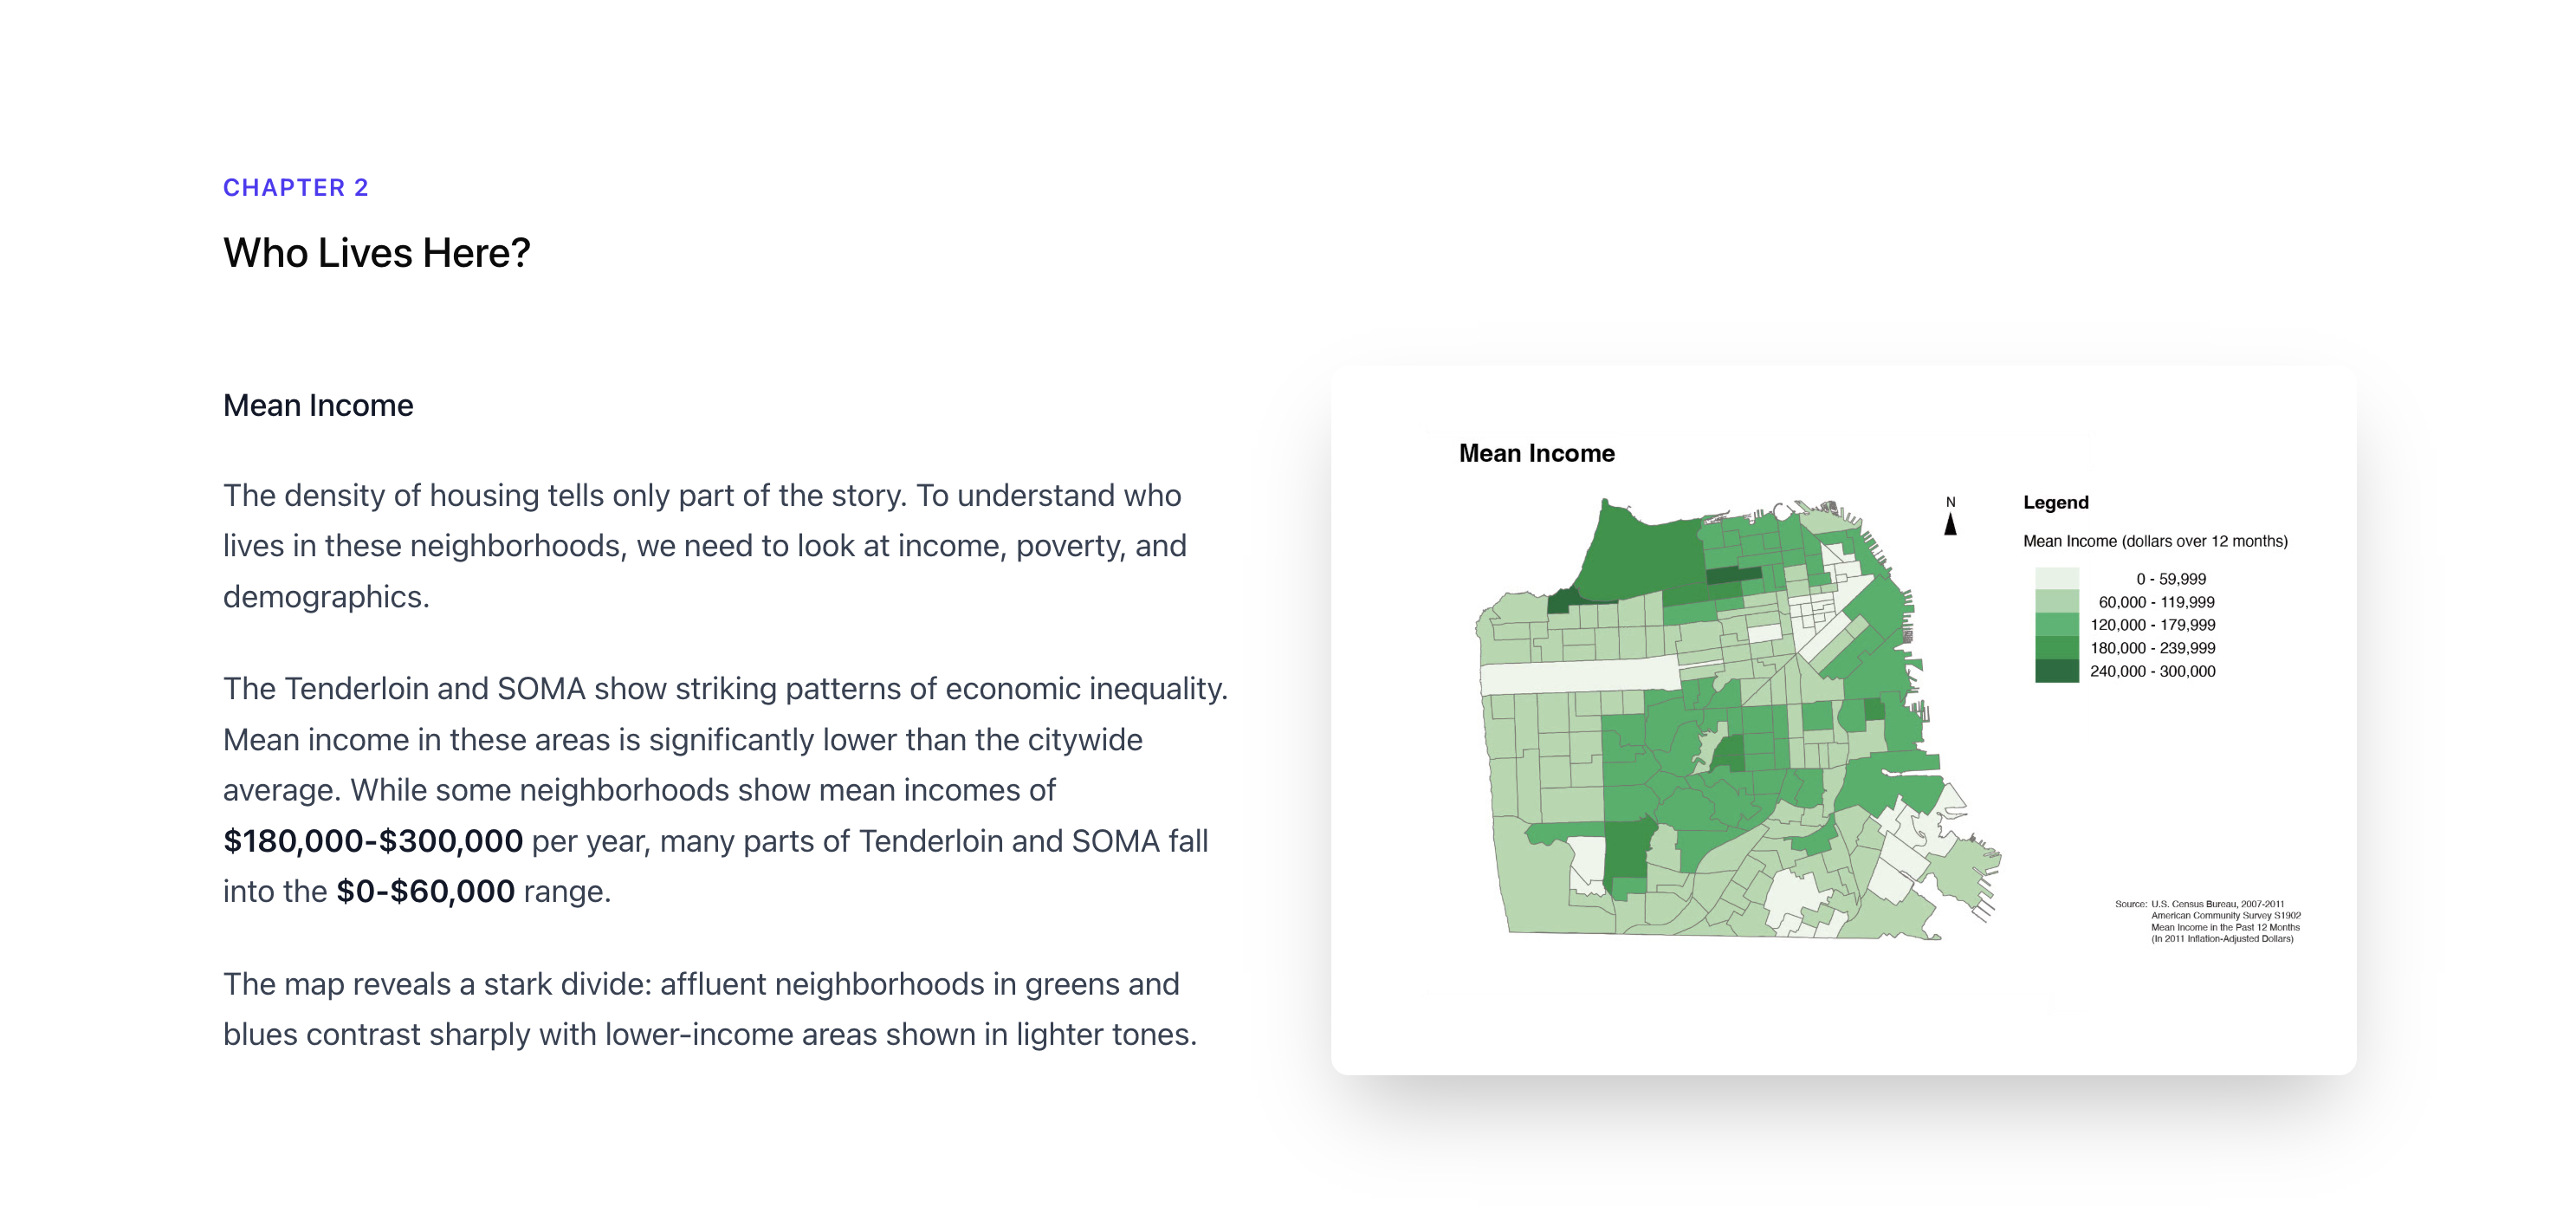
Street Safety & Public Space Impact
This data story visualization explores how street design decisions shape safety in public space. It draws on open mobility and safety datasets to reveal patterns in collisions, trends, and outcomes over time.
And the insights? 🤔 They highlight the real-world consequences of how our streets are designed.