Bike Rental Dashboard & Live Data
A live dashboard of bike rental station locations and real-time availability across the Amsterdam metropolitan area, built on top of the Donkey Republic GBFS open mobility feed.
Overview
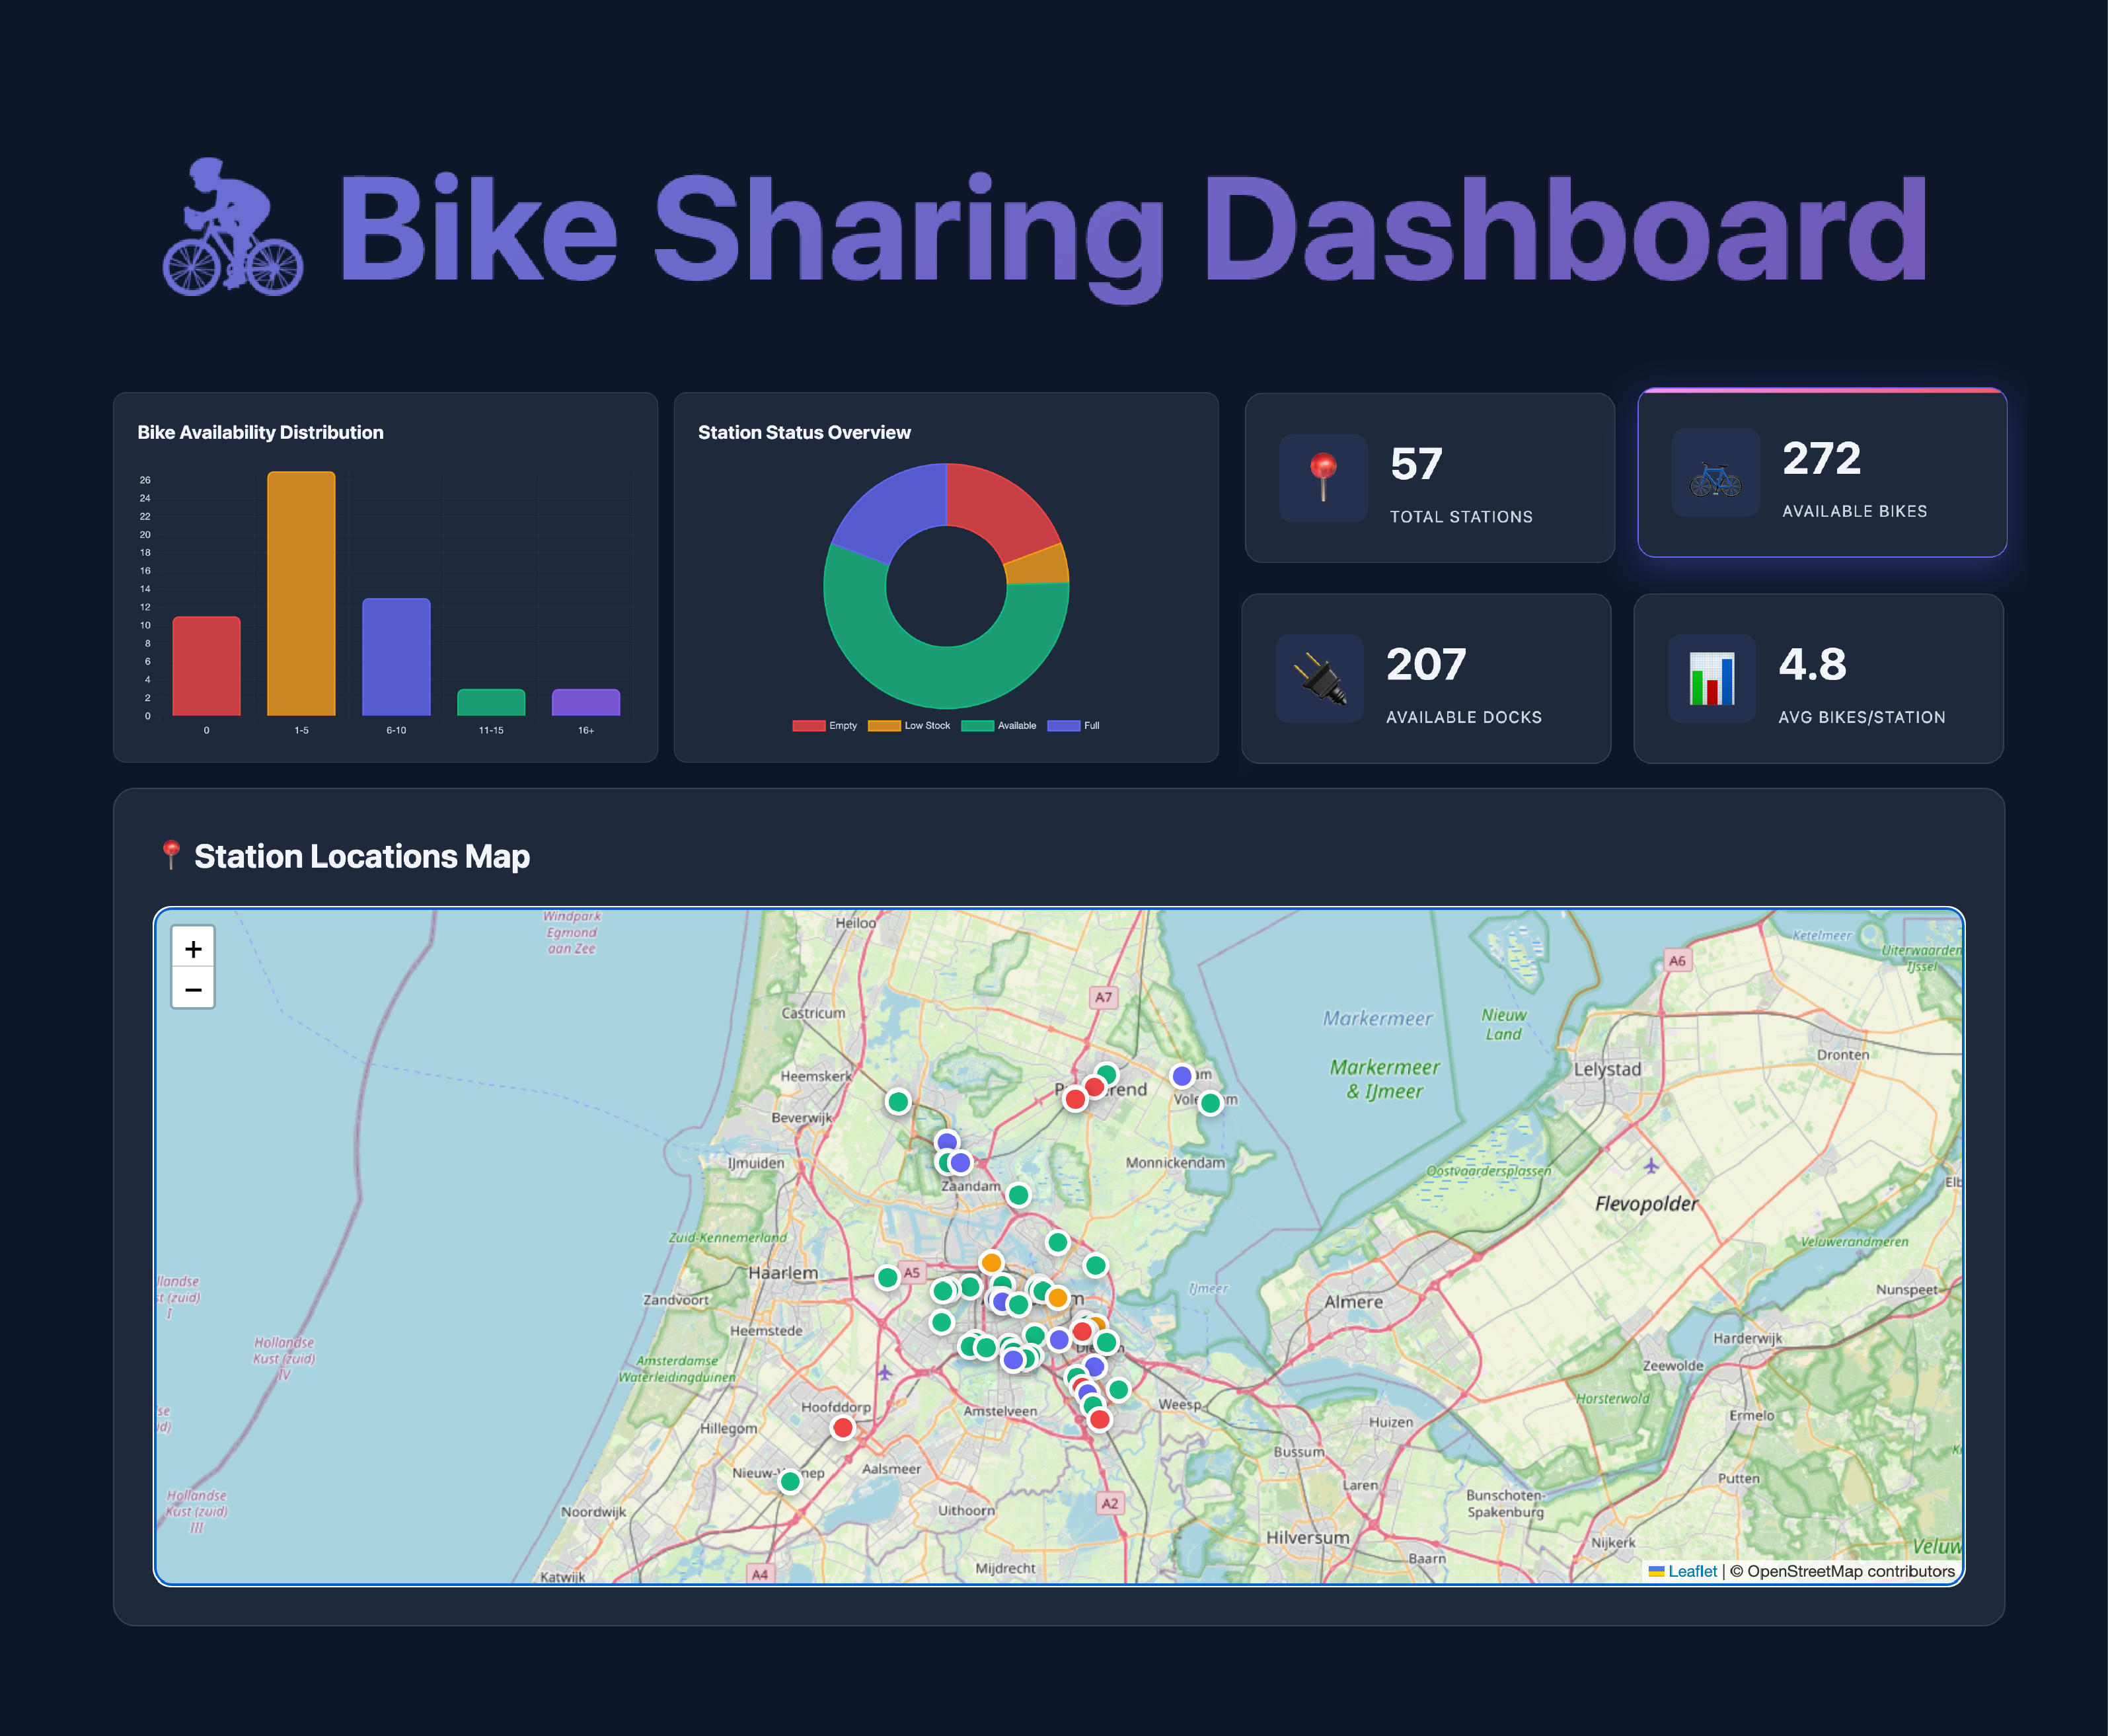
This dashboard visualises the locations of Donkey Republic bike rental stations across the Amsterdam metropolitan area alongside the number of available bikes and docks at each one. Powered by the operator’s public GBFS feed, it provides an up-to-date snapshot of the network — refreshed automatically so the picture you see reflects the current state of the system.
The view combines four headline figures (total stations, available bikes, available docks, average bikes per station) with an interactive Leaflet map, two summary charts, and a searchable, sortable list of every station. Markers on the map are colour-coded by status (available, low, empty, full), and clicking a station card pans the map to that location.
Methodology
Station metadata (id, name, latitude, longitude, address) is read from the
GBFS station_information.json endpoint, and live availability (bikes,
docks, operational flags) from station_status.json. The two feeds are
joined on station_id in the browser to produce a single merged record per
station.
The dashboard is implemented as a static HTML/CSS/JavaScript page — no
backend. Leaflet renders the map using
OpenStreetMap tiles, and Chart.js handles the
availability-distribution bar chart and the status-overview doughnut chart.
Filtering, sorting, search, and grid/linear view toggling are all done
client-side; the user’s view preference is persisted in localStorage.
Stations are classified into four status buckets from their bike-to-total ratio: empty (0 bikes), full (0 docks), low (fewer than 25 % of slots filled with bikes), and available otherwise.
Findings
The snapshot embedded in this build covers 57 stations across the
Amsterdam region (region id 381), spanning roughly Hoofddorp in the
south-west to Purmerend and Edam-Volendam in the north, with 272 bikes
and 207 docks available in total — an average of 4.8 bikes per
station.
Availability is visibly uneven across the network:
- 11 stations are empty (zero bikes available) and 11 are full (zero free docks) — together about 39 % of the network is at one extreme or the other at the moment of capture.
- The five stations with the most bikes are all large indoor or underground parking facilities at major transit hubs: !PARK INDOOR! CS River (25), !PARK INDOOR! Amstelstation (16), !PARK UNDERGROUND! Stationspleinstalling (16), Hotel Jansen (15) and !PARK INDOOR! CS Center (14). Central Station and Amstelstation alone account for a meaningful share of the total fleet visible at any given moment.
- Stations further from the centre — Krommenie, Purmerend Weidevenne, Edam, Hoofddorp, Halfweg — tend to sit either empty or full, consistent with bikes flowing inward toward the city centre during the day.
Takeaways
The Donkey Republic GBFS feed is a good example of why technical openness matters as much as legal openness in ODON’s Open Data Maturity Model: a stable, documented, machine-readable feed makes it possible to build a useful public-facing tool in a single static page, with no infrastructure beyond a browser. Real-time open mobility data of this quality lets riders plan trips, lets operators rebalance fleets, and lets city planners see — station by station — where additional capacity or rebalancing effort is most needed.
Data Sources
Ratings use the ODON Open Data Maturity Model (ODMM).
-
Donkey Republic GBFS — Amsterdam (station_information & station_status)
Legal L3 The GBFS feed is publicly accessible without authentication but carries no explicit open-licence declaration from the operator. Free use is established by convention across the GBFS ecosystem, but formal terms are not stated — placing it at L3 rather than L4.
Technical T4 Follows the open GBFS standard (General Bikeshare Feed Specification): a documented, versioned JSON API served live with no download or registration step required. Immediately machine-readable — T4.
Tools Used
- HTML
- JavaScript
- Chart.js
- Leaflet
- OpenStreetMap