Data Stories
A curated collection of data stories, dashboards, and visualisations produced by the ODON team and contributors from our community. Browse the published work below — from live dashboards to in-depth data investigations.
Every entry documents its data sources using our Open Data Maturity Model (ODMM), so you can see exactly how open the underlying data is. Interested in a similar project for your organisation? See our Services.
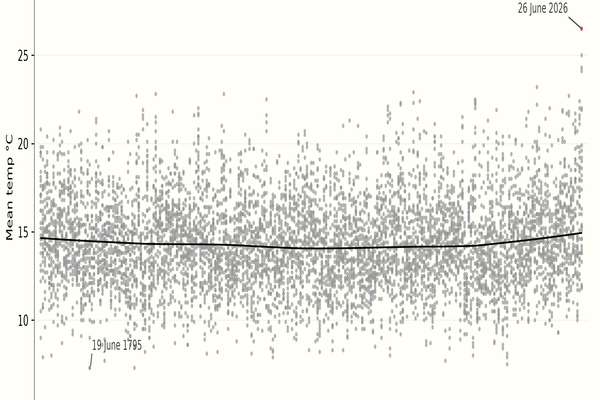
May broke records in England — Central England's warmest May day in 254 years came on 26 May 2026. But June was record-breaking by huge margins across many...
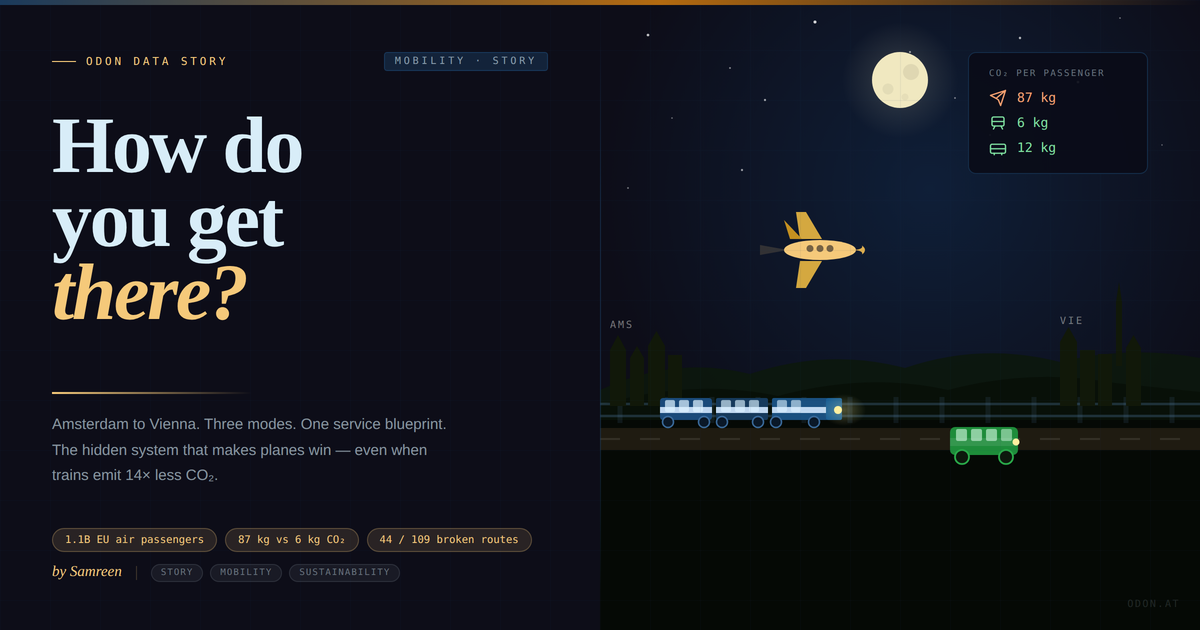
Amsterdam to Vienna. Three modes. One service blueprint. The hidden system that explains why planes win — even when trains emit 14× less CO₂.
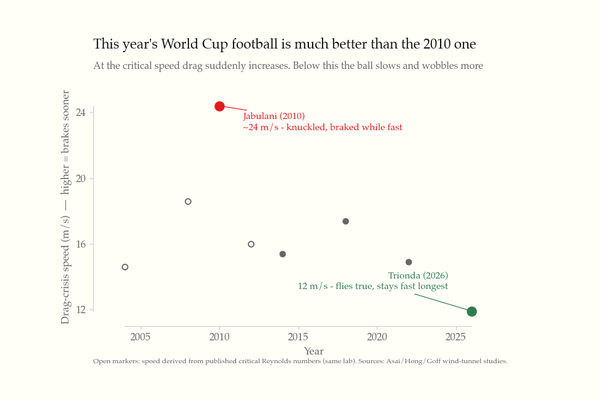
Pope John Paul II once said "out of all the unimportant things, football is the most important." Of the unimportant things in football I think the football itself...
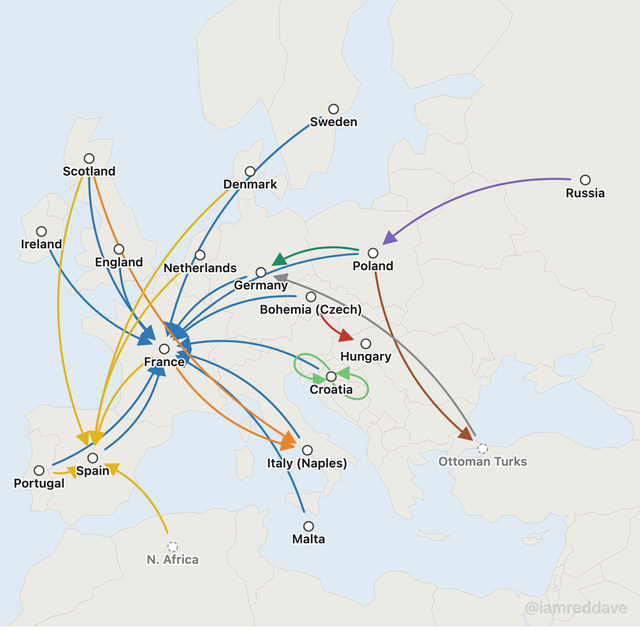
When syphilis swept Europe after the 1495 Naples outbreak, no nation would own it — each named the disease after a neighbour or enemy. This interactive map traces...
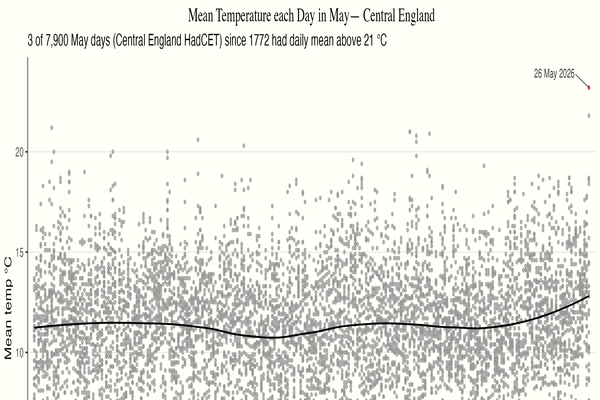
On 26 May 2026, Central England recorded its highest daily mean temperature for any May day in 254 years of measurement. This interactive chart places that 23.2°C reading...
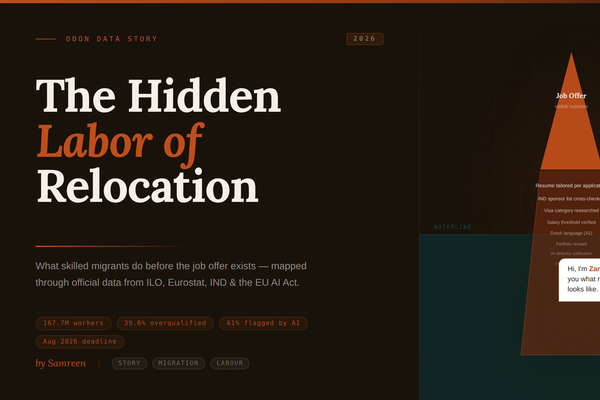
What skilled migrants do before the job offer exists — mapped through official data from ILO, Eurostat, IND & the EU AI Act.
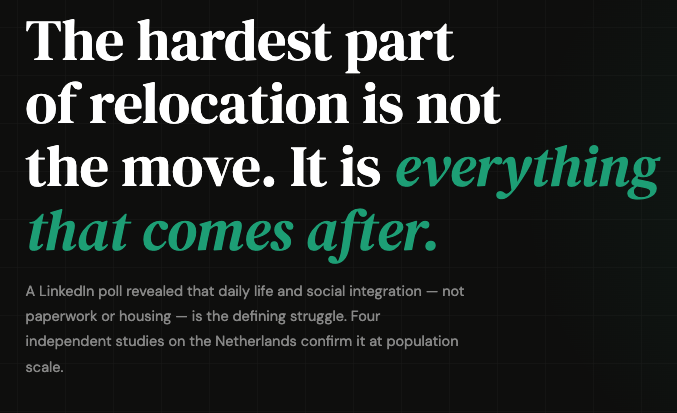
Original poll data and four NL-specific studies reveal that daily life integration and social belonging — not paperwork or housing — are the hardest parts of relocating. Using...
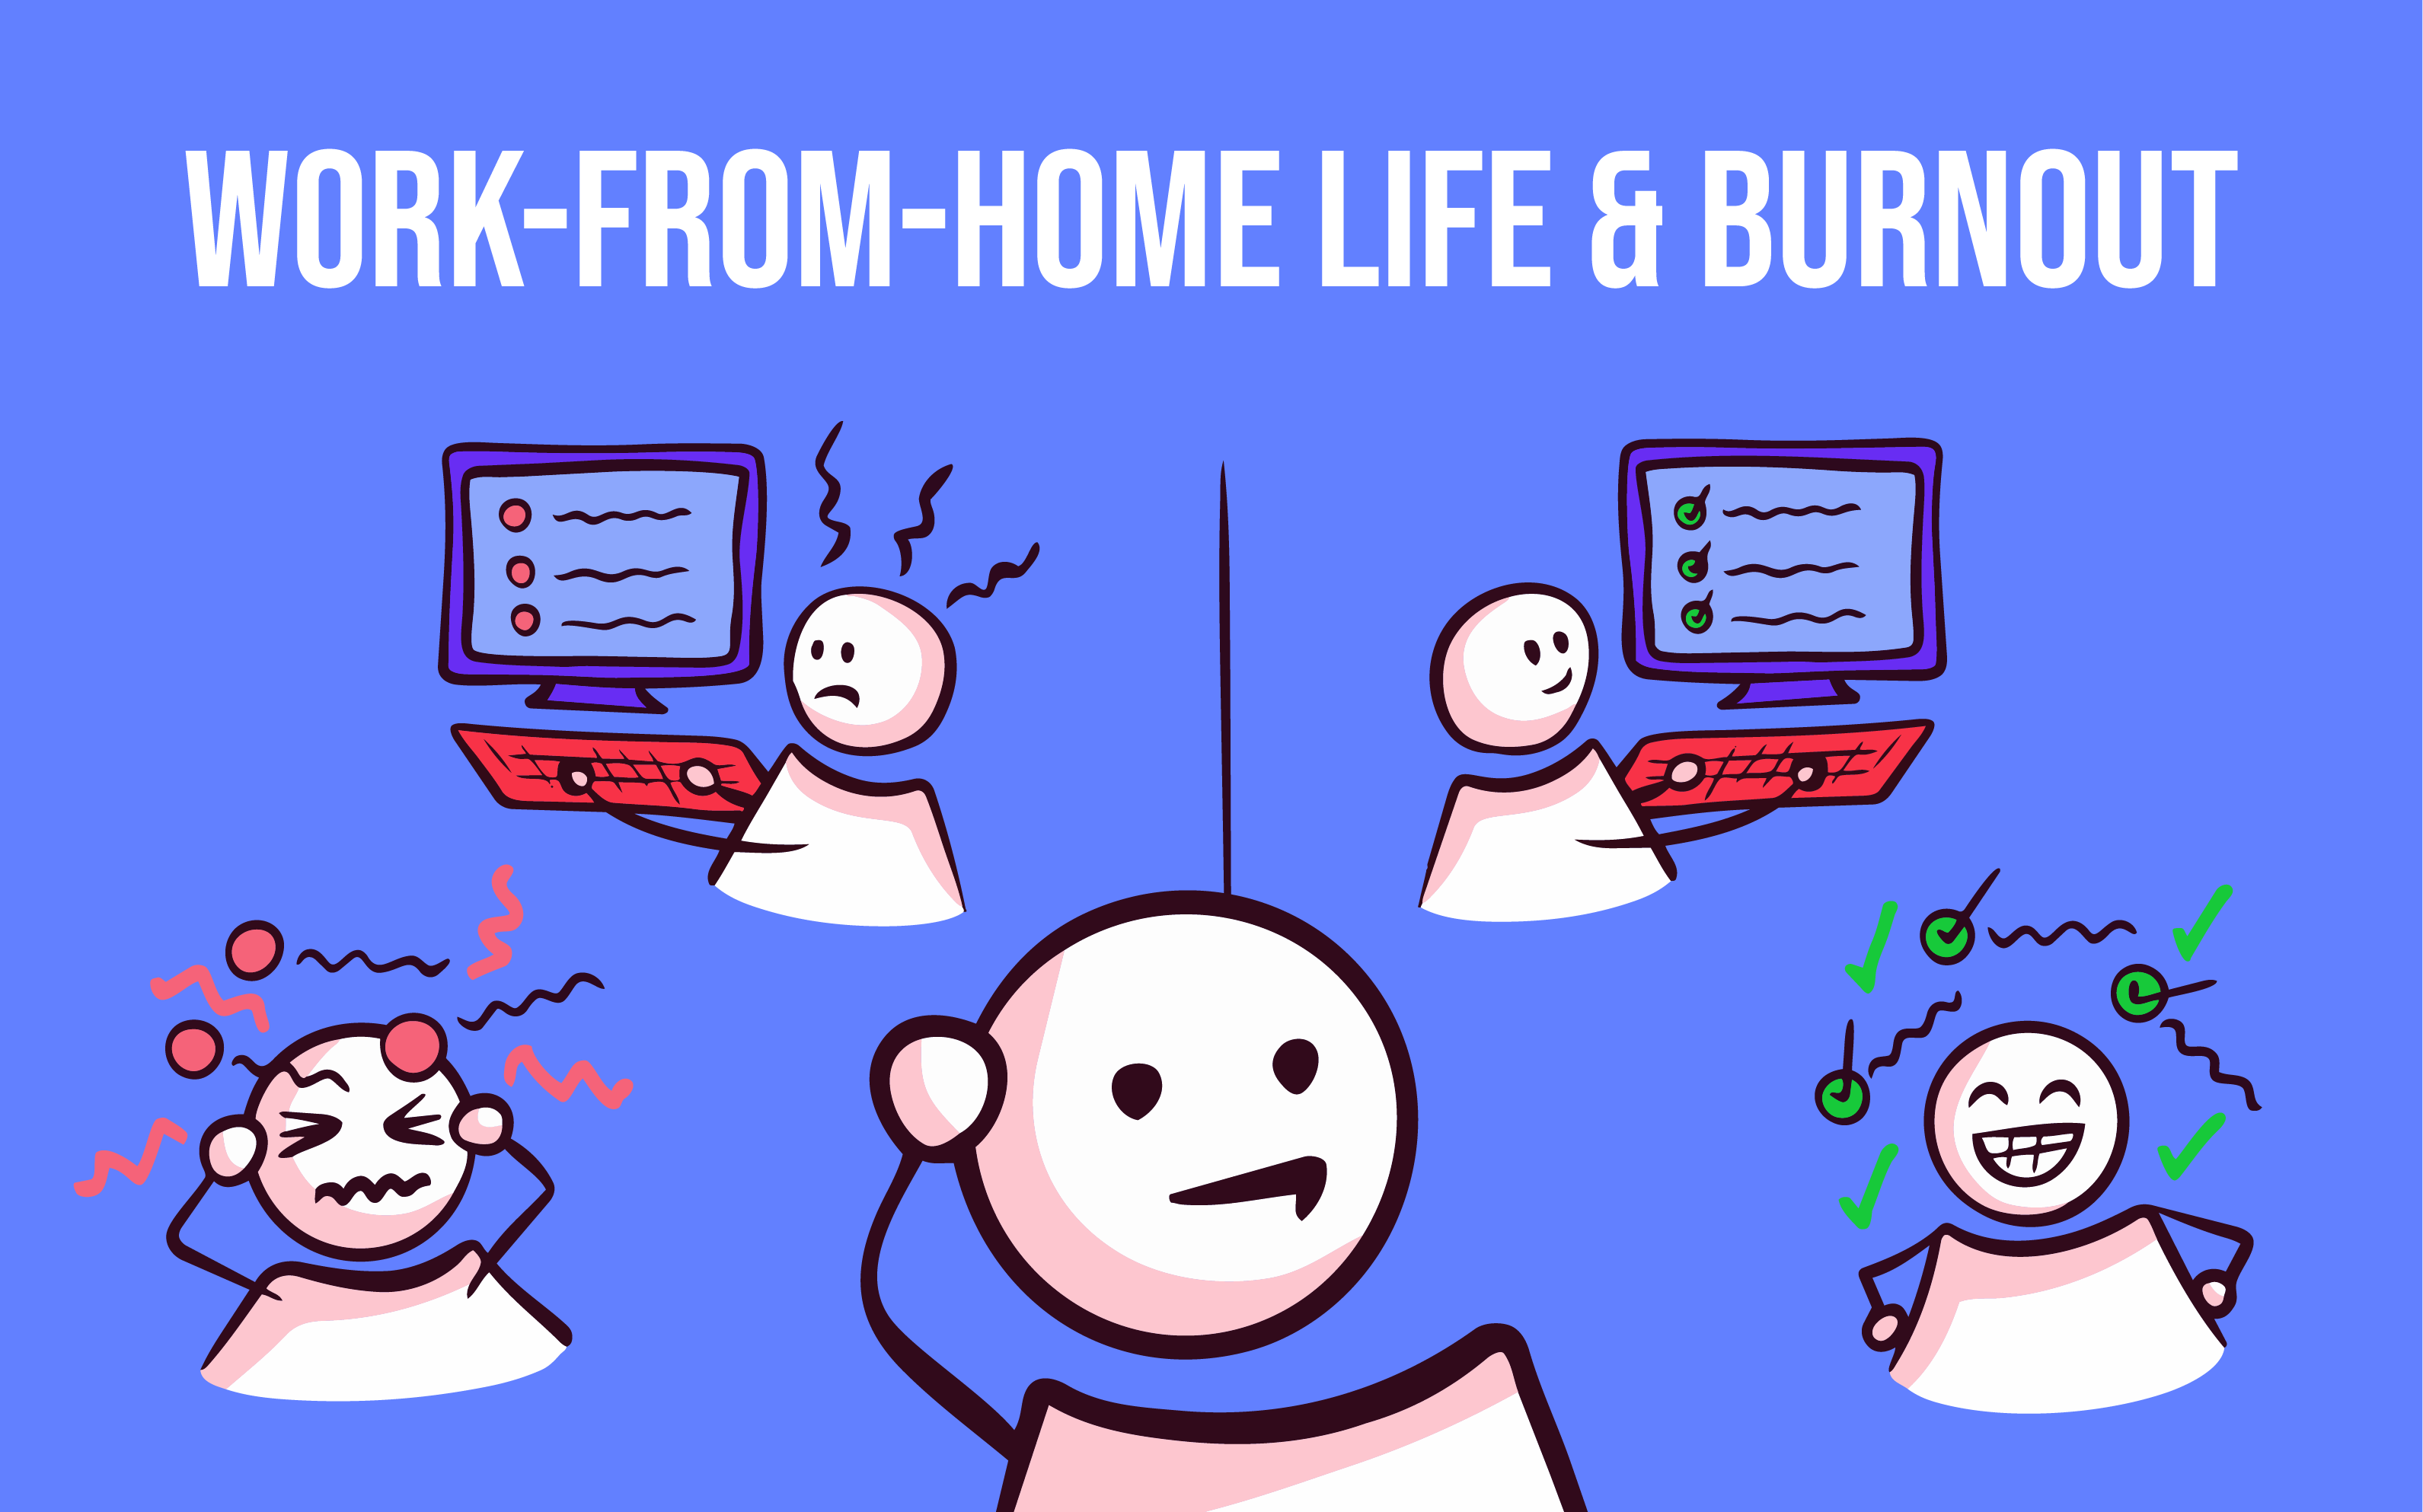
A data story exploring the relationship between remote work conditions and burnout, based on a dataset of 1,600 survey responses — with findings that challenge common assumptions.
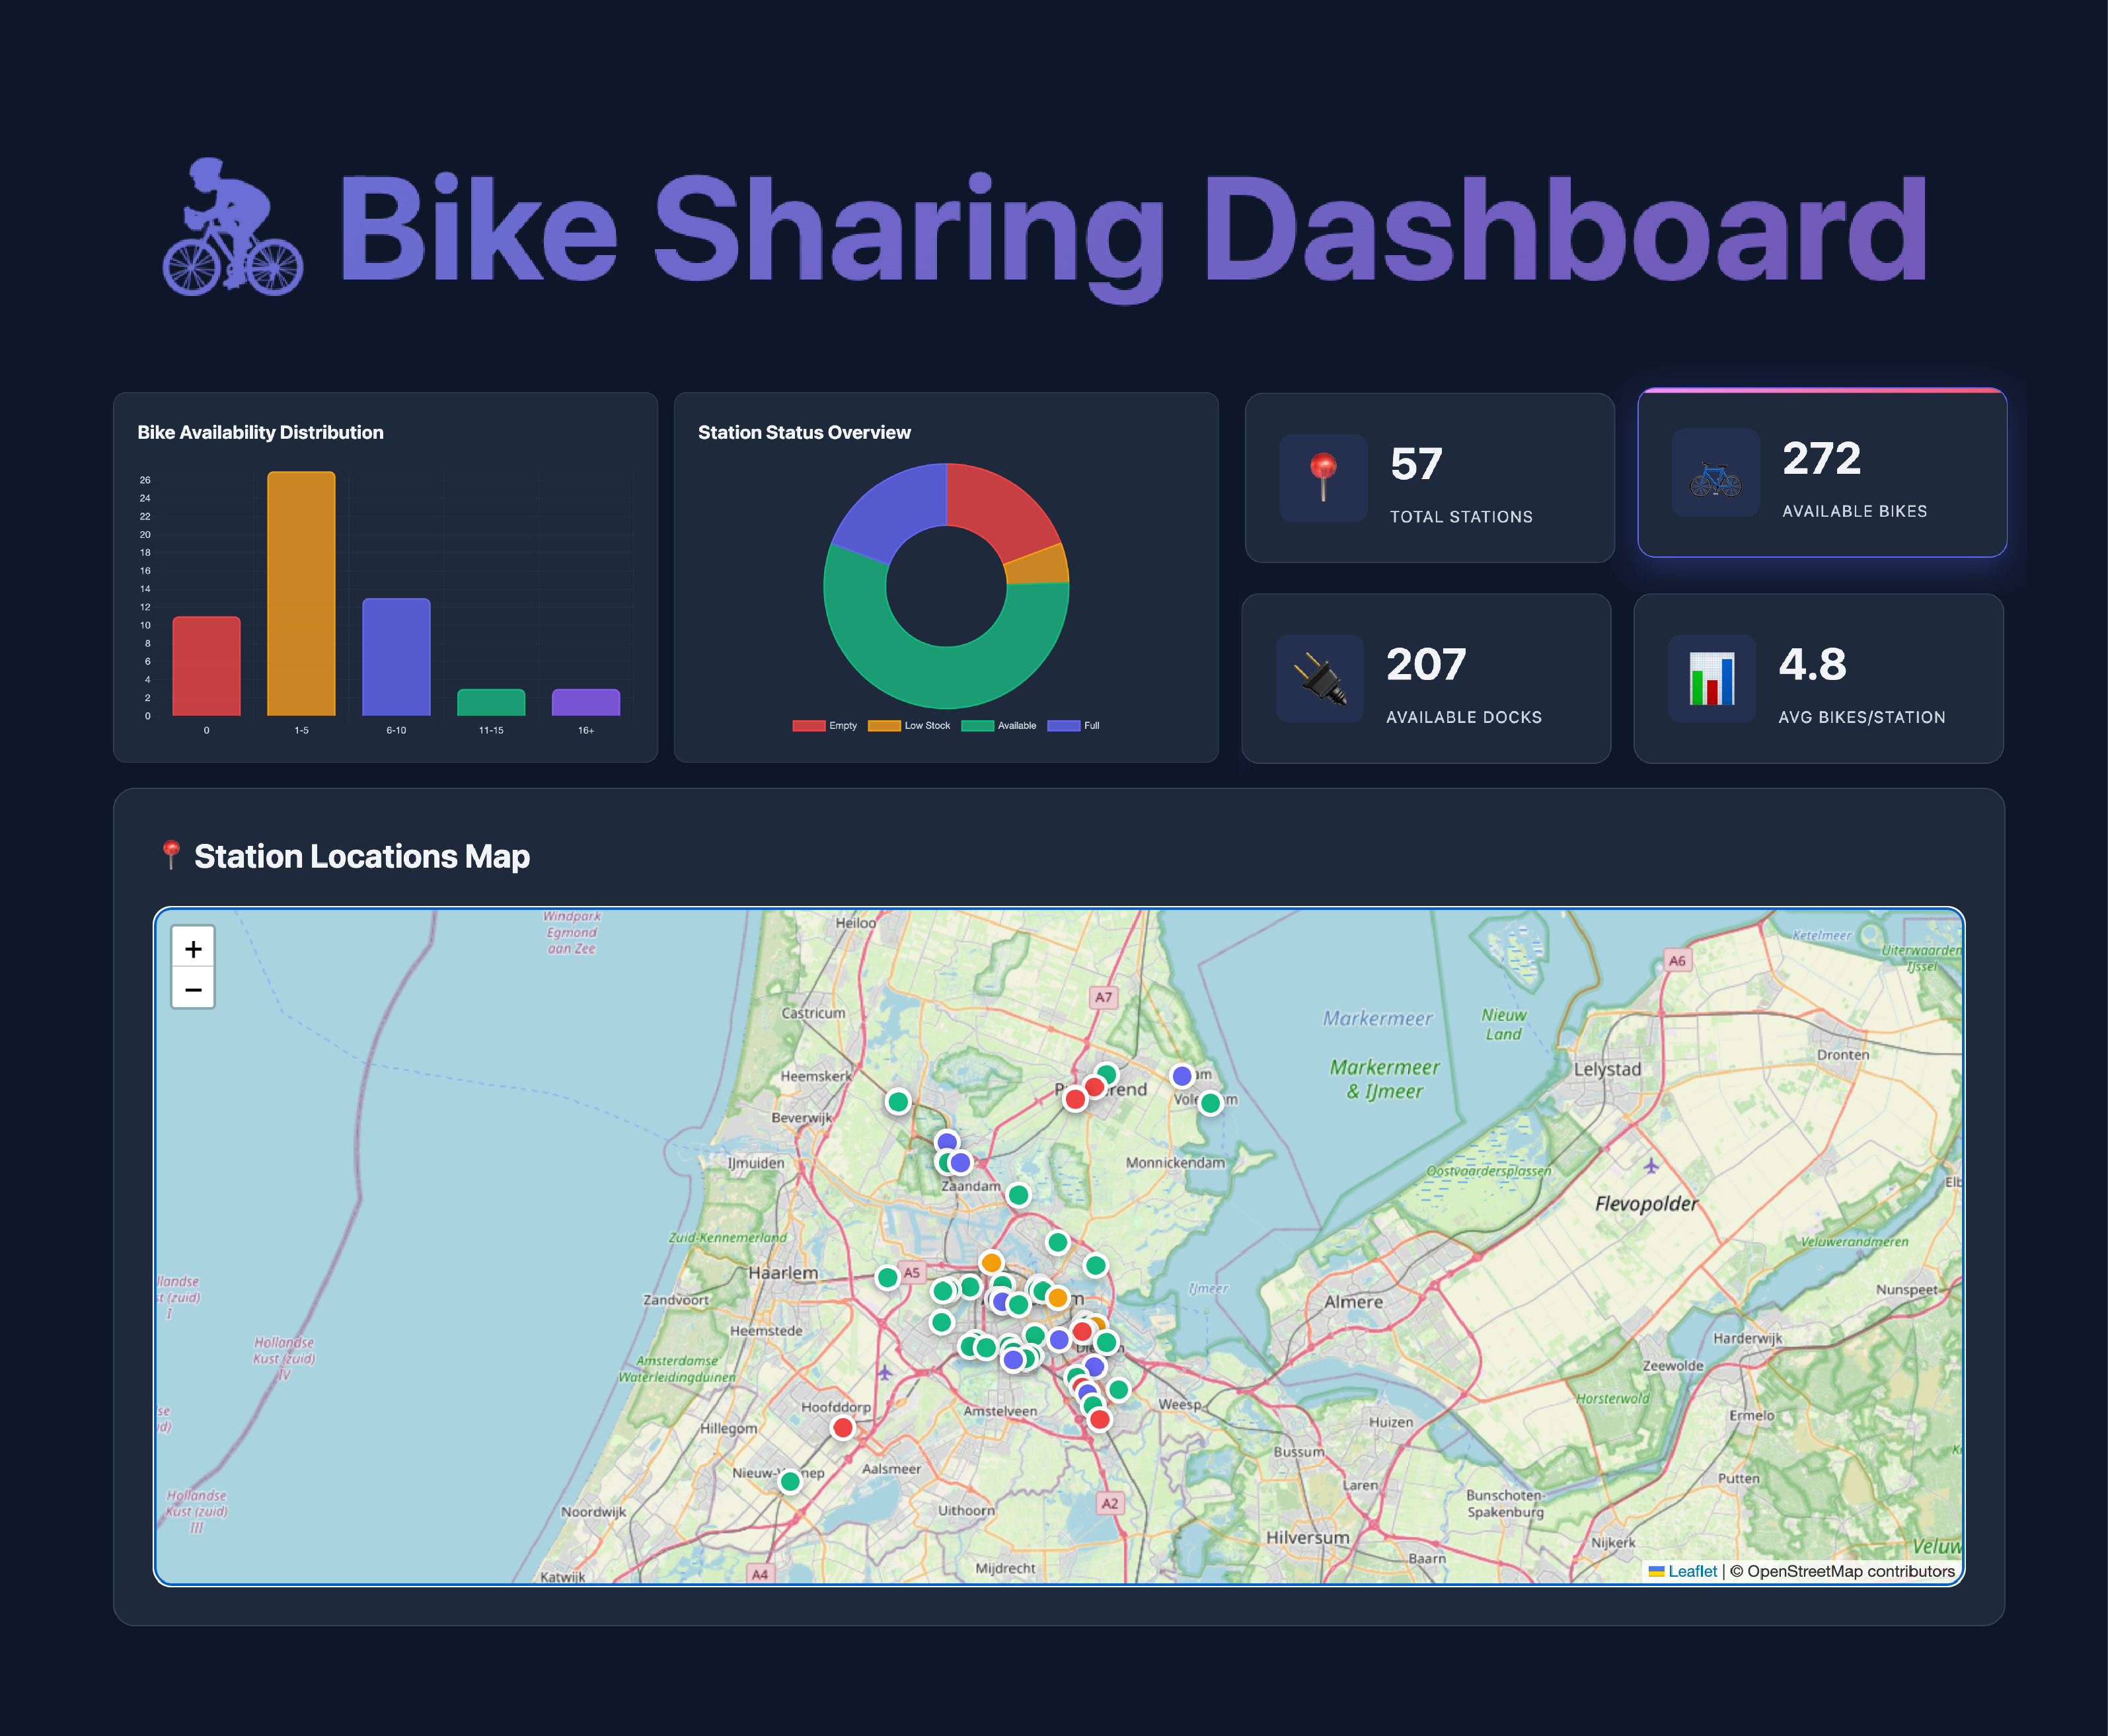
A live dashboard of bike rental station locations and real-time availability across the Amsterdam metropolitan area, built on top of the Donkey Republic GBFS open mobility feed.
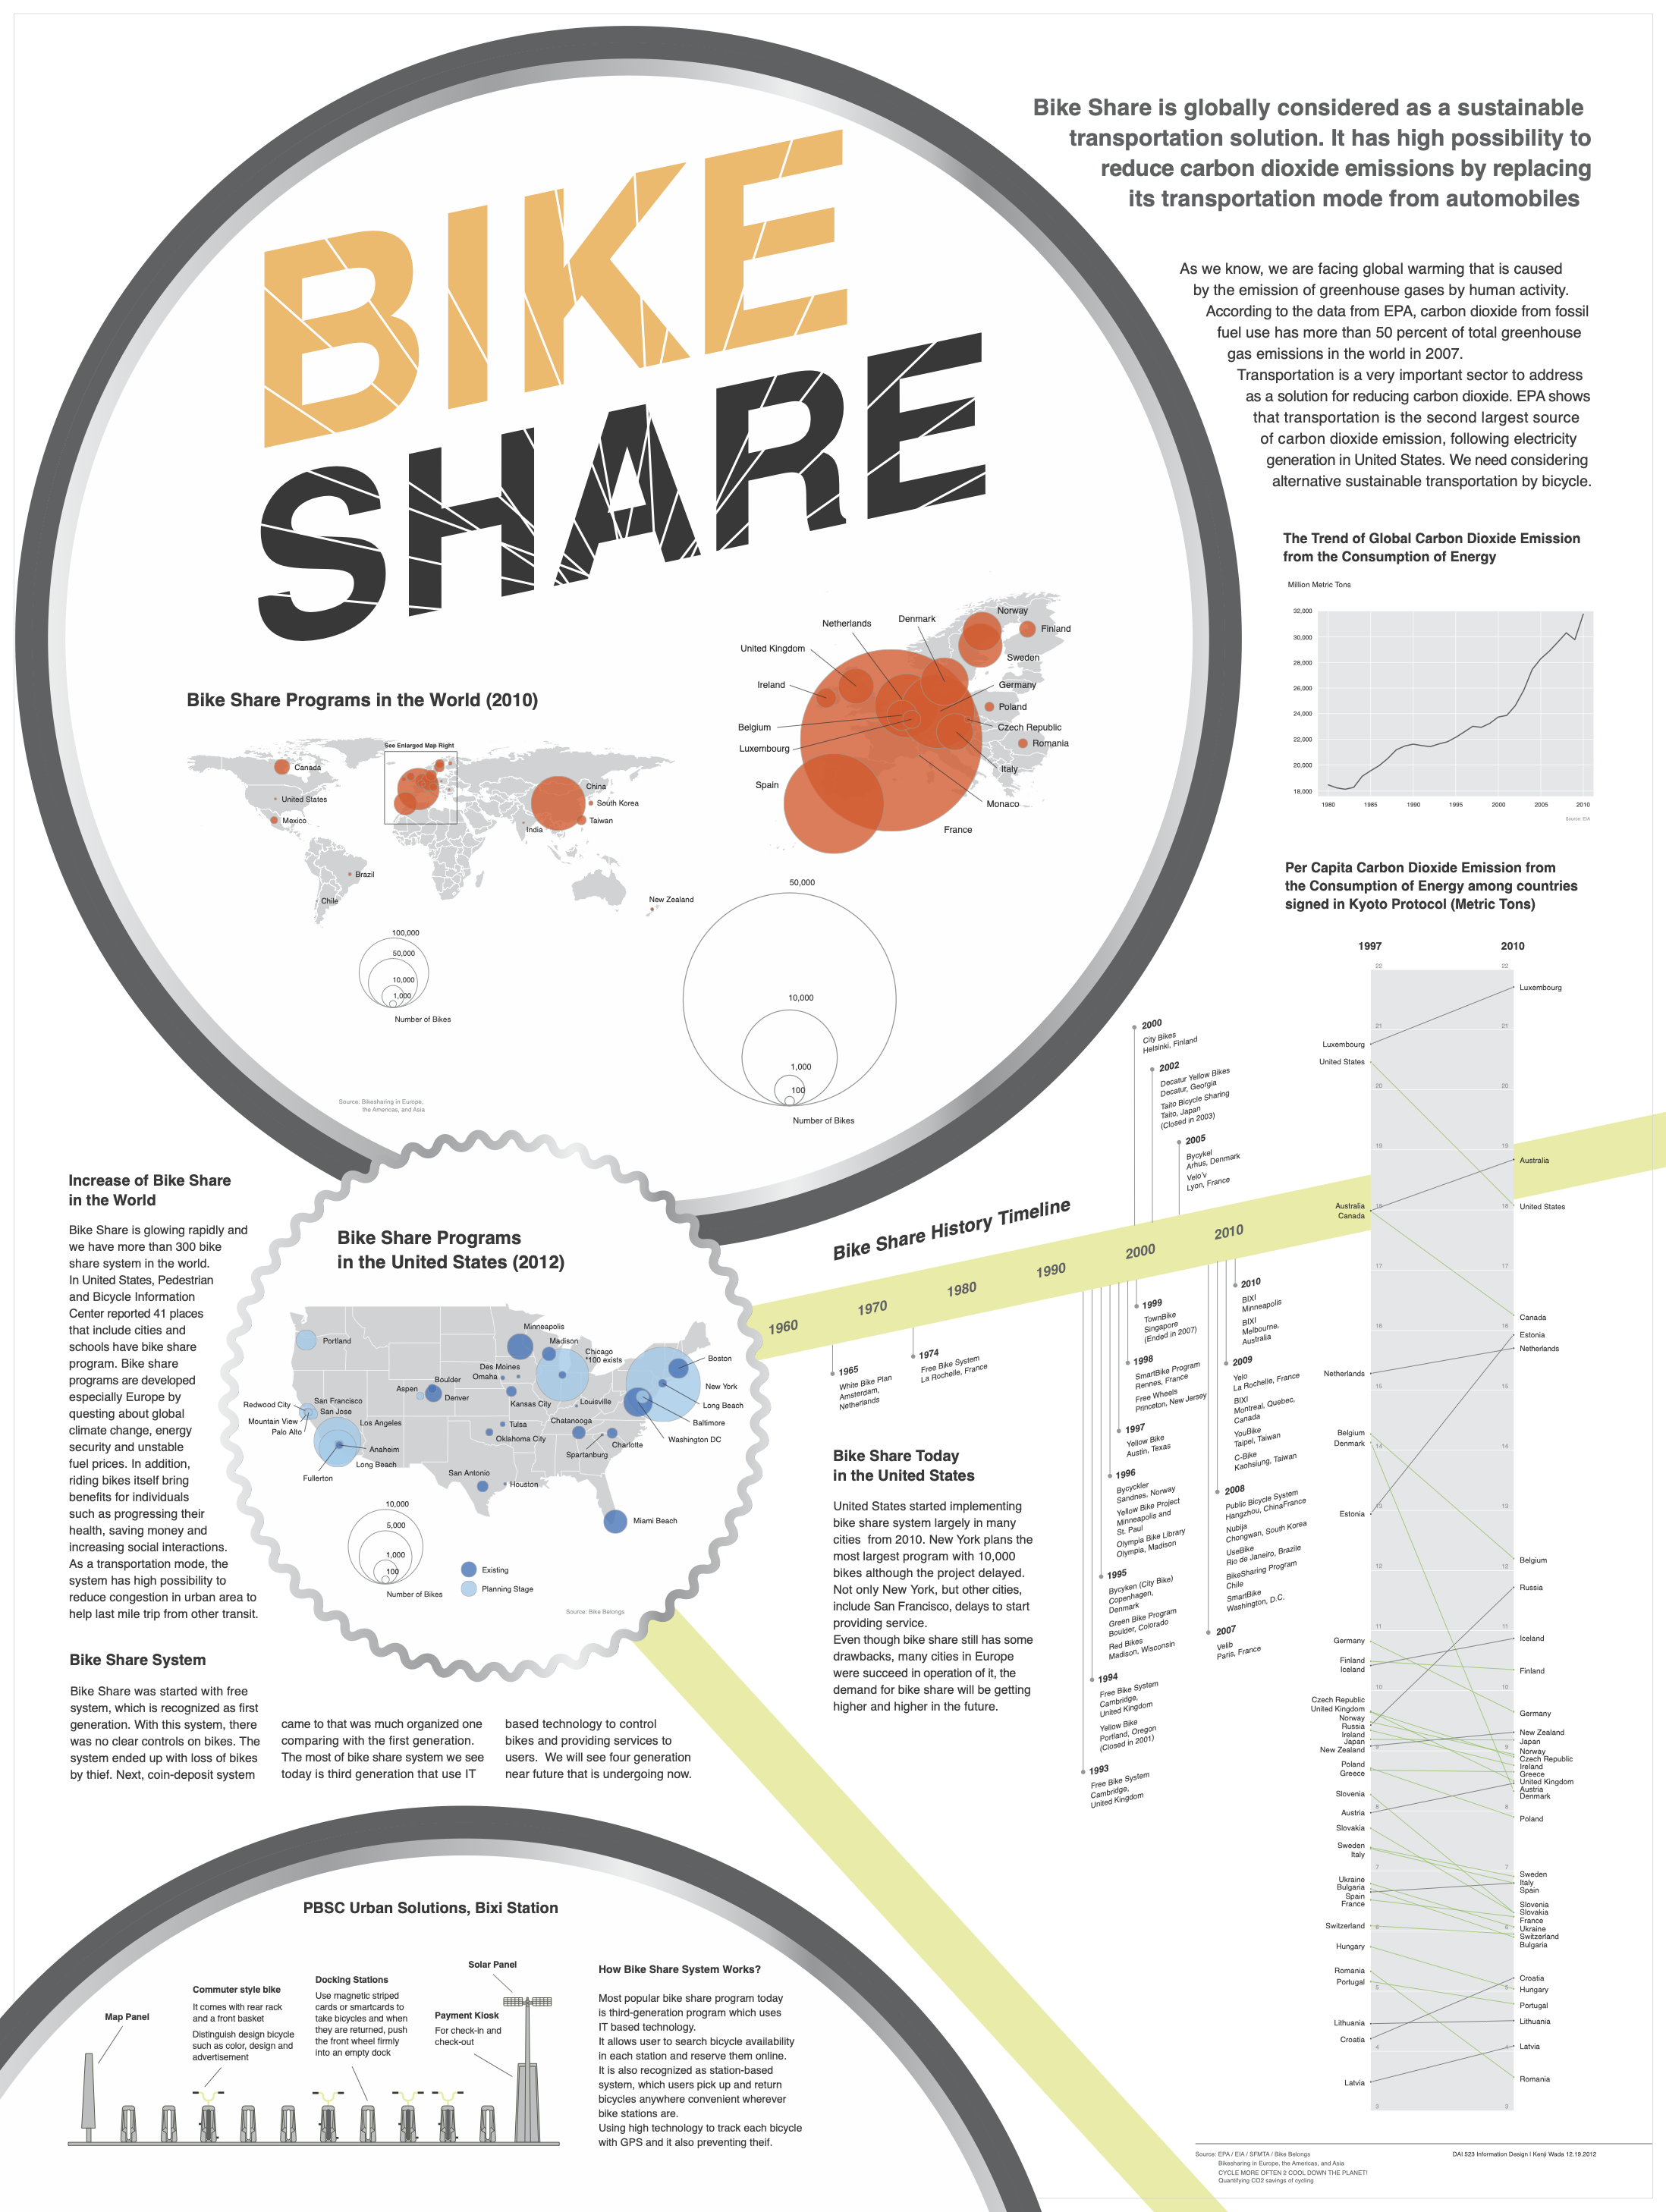
An information-design poster tracing the global rise of bike share programs and their potential to cut transport-sector carbon dioxide emissions.
No stories match your filters. Clear filters