Bike Share & Sustainable Mobility
An information-design poster tracing the global rise of bike share programs and their potential to cut transport-sector carbon dioxide emissions.
This work was originally created in 2012 for DAI 523 Information Design, a graduate course in the Master's program at San Francisco State University (SFSU).
Overview
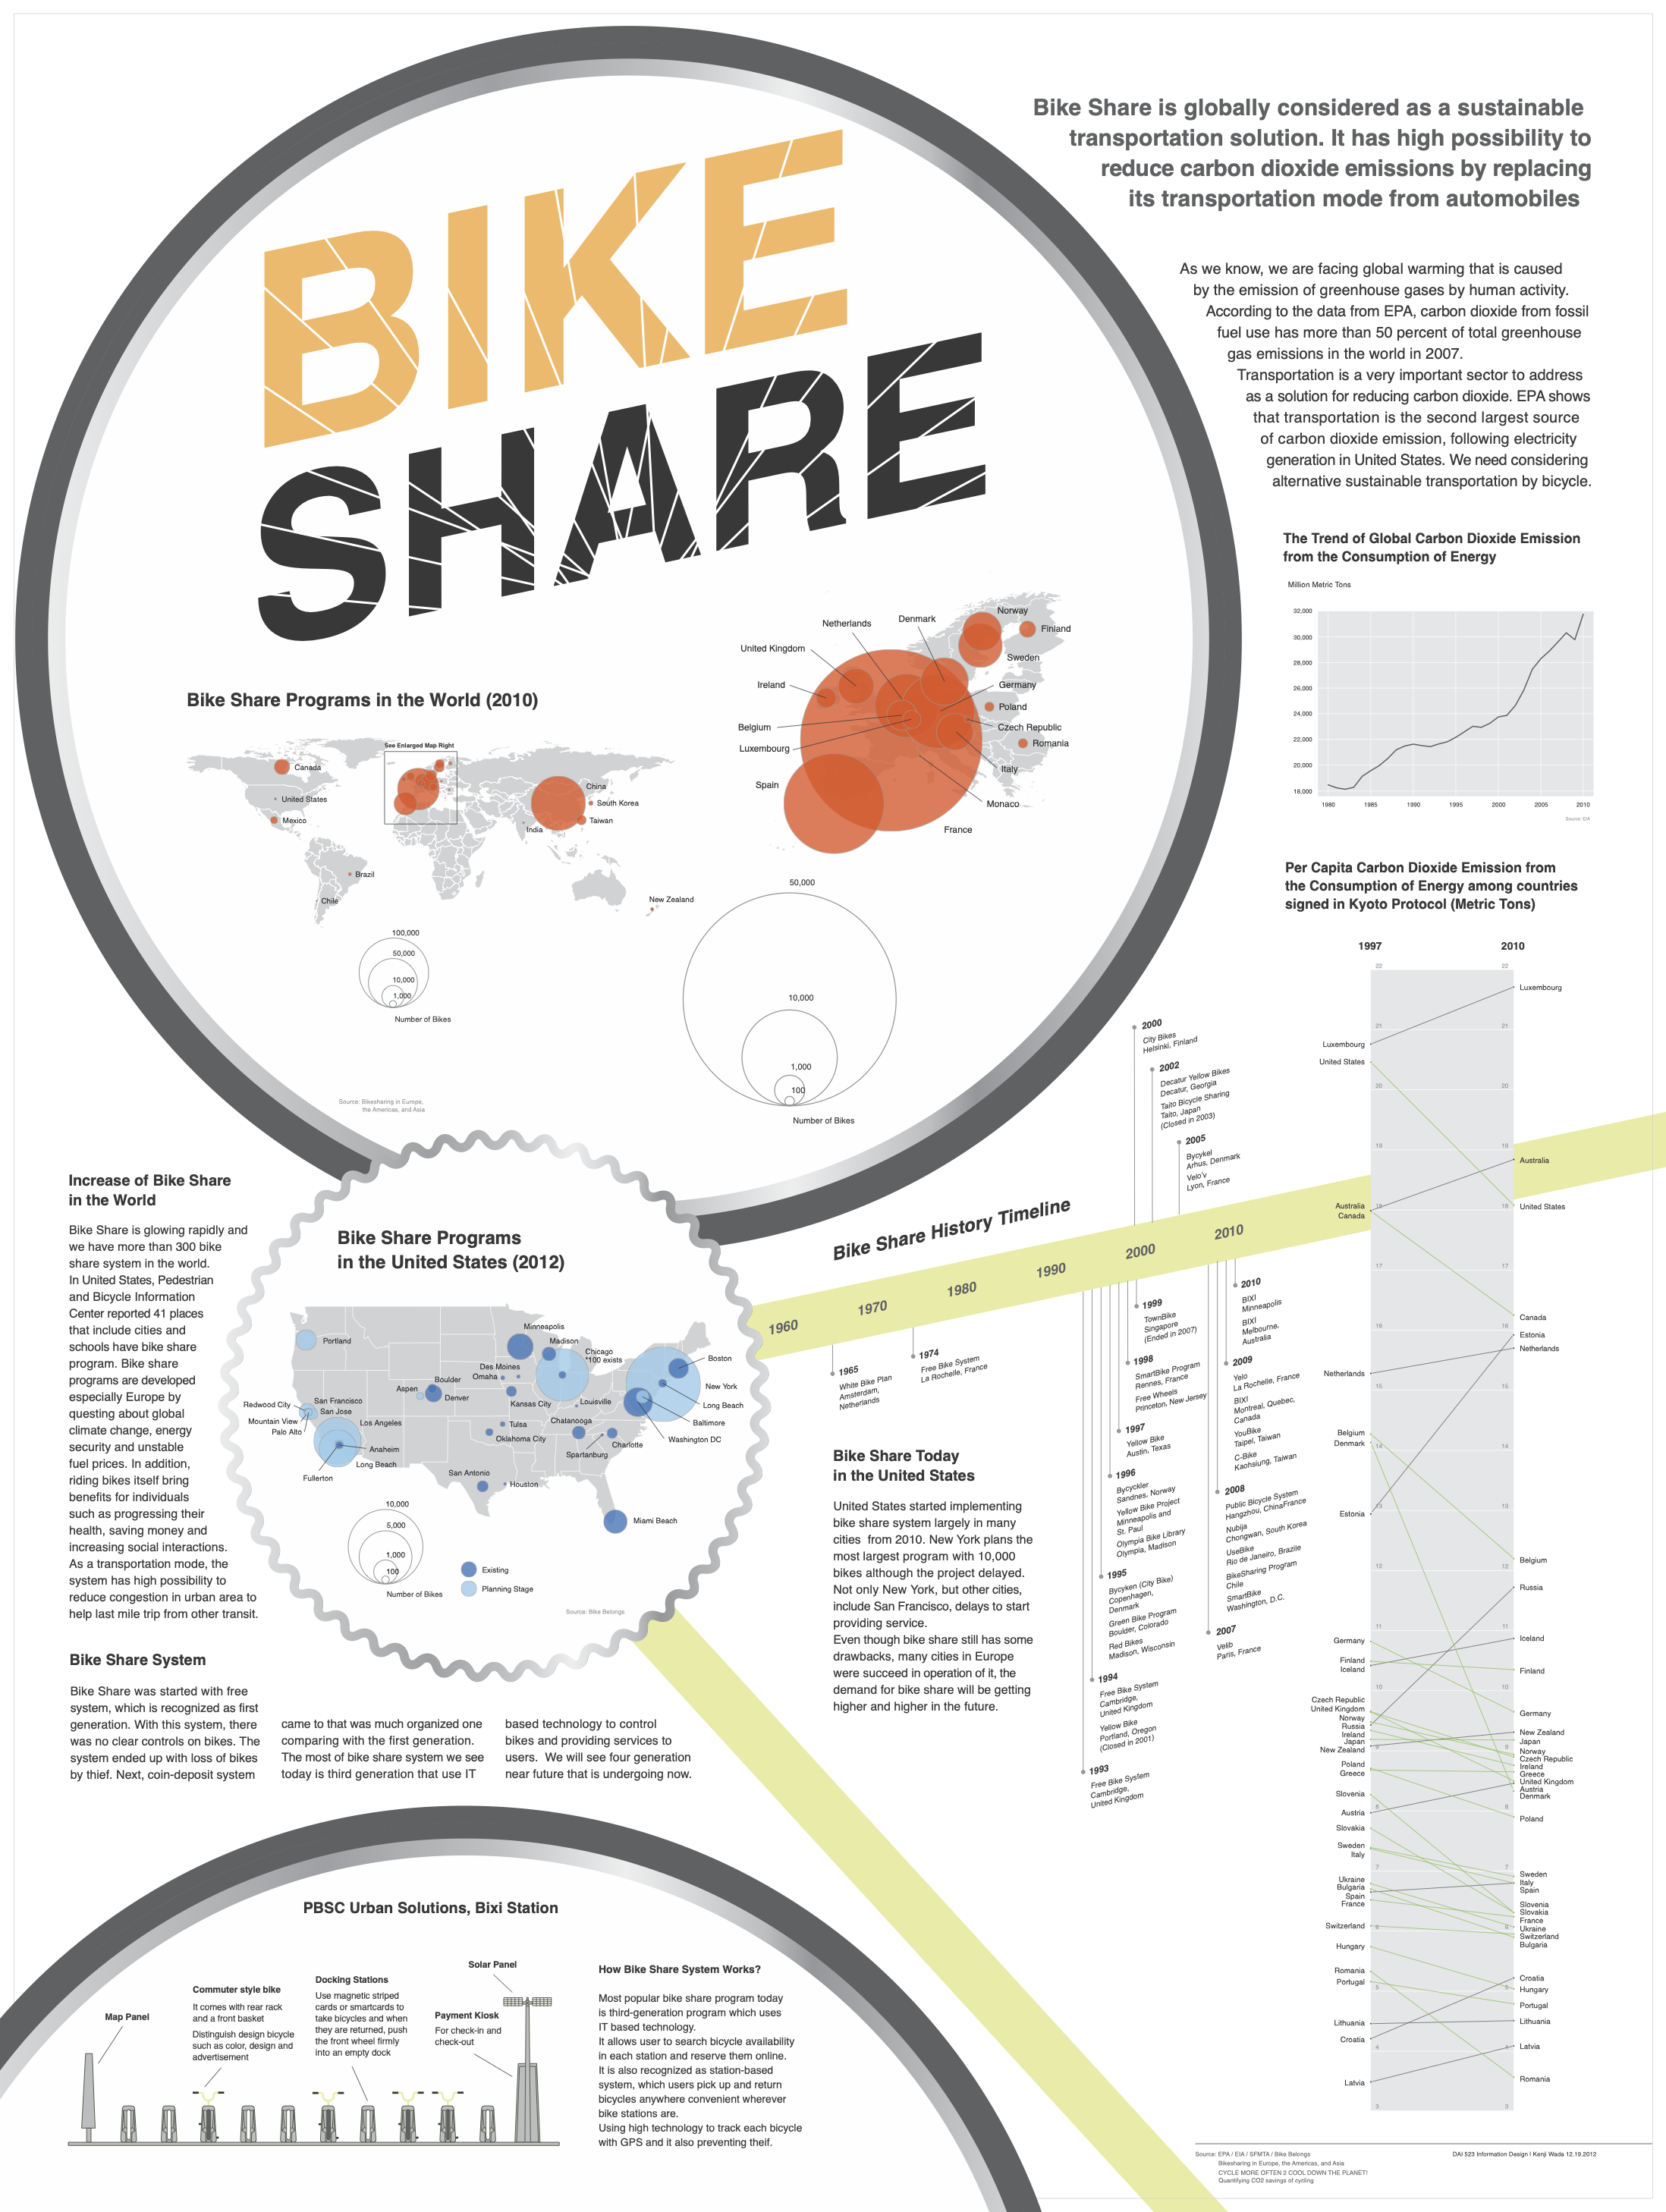
Bike share is globally considered a sustainable transportation solution, with strong potential to reduce carbon dioxide emissions by replacing car trips with bicycle trips. This story sets that proposition against the wider emissions picture: according to the EPA, carbon dioxide from fossil fuel use accounted for more than 50 percent of total greenhouse gas emissions worldwide in 2007, and transportation is the second-largest source of CO2 emissions in the United States after electricity generation. Cycling — and station-based bike share in particular — is presented as a credible alternative.
Methodology
The story is a single-page information-design poster that brings several open data sources into one frame. Global CO2 emissions trends from the EIA are charted from 1980 to 2010. Per-capita emissions for Kyoto Protocol signatories are compared across two snapshots, 1997 and 2010, using a slope-style chart. A worldwide map plots bike share program scale by number of bikes (2010), with an enlarged European inset, and a U.S. map shows existing and planned programs as of 2012. A horizontal timeline traces the history of bike share schemes from the 1960s through 2010, picking out individual programs (White Bike Plan in Amsterdam, La Rochelle’s free bike system, Vélib’, BIXI, and others). Sources are EPA, EIA, SFMTA, People for Bikes (Bike Belongs), Shaheen, Guzman & Zhang’s Bikesharing in Europe, the Americas, and Asia, and the European Cyclists’ Federation’s Cycle More Often 2 Cool Down the Planet!. The poster was composed in Adobe Illustrator.
Findings
Bike share has grown rapidly: as of 2010 there were more than 300 bike share systems worldwide, with the largest fleets concentrated in France, Spain, Italy and China. In the United States, the Pedestrian and Bicycle Information Center reported 41 cities and schools with bike share programs by 2012, and New York’s planned 10,000-bike system was set to be the country’s largest. The system has evolved through three generations — from the original free-bike schemes that lost most of their inventory to theft, to coin-deposit systems, to today’s IT-enabled, station-based programs that use smartcards, online reservation and GPS tracking. Per-capita CO2 emissions data shows that several high-emitting Kyoto signatories made little progress between 1997 and 2010, sharpening the case for transport-sector interventions like bike share.
Takeaways
Even with operational drawbacks, bike share is a working example of a sustainable transport mode that can reduce urban congestion, support last-mile trips from other transit, and deliver individual benefits — better health, savings, more social interaction. European cities have shown the model works at scale; demand for bike share is likely to keep rising. Bringing together emissions data, program inventories and the history of the systems themselves makes the policy case more concrete than any single dataset would on its own.
References
The following sources informed the narrative but are scholarly or advocacy publications rather than datasets, and are therefore not classified under the ODMM.
- Shaheen, S., Guzman, S., & Zhang, H. (2010). Bikesharing in Europe, the Americas, and Asia. Transportation Research Record: Journal of the Transportation Research Board, 2143, 159–167.
- European Cyclists’ Federation. (2011). Cycle More Often 2 Cool Down the Planet! Quantifying CO2 savings of cycling.
Gallery
The central argument: bike share can replace car trips and cut CO2 emissions
Global CO2 emissions from energy consumption, 1980–2010 (source: EIA)
Per-capita CO2 emissions 1997 vs. 2010 — many high-emitting signatories made little progress
Bike share programs worldwide in 2010 — circle size proportional to number of bikes
Europe detail — France, Spain and Italy lead the world in bike share fleet size
Three generations of bike share: from free bikes lost to theft, to coin-deposit, to IT-enabled station systems
US bike share in 2012 — 41 cities and schools, with New York planning the largest system
From first-generation free bikes to GPS-tracked, station-based third-generation systems
How it works: a BIXI station with smartcard check-in, docking locks and solar-powered kiosk
The complete poster — DAI 523 Information Design, Kenji Wada, 19 December 2012
Data Sources
Ratings use the ODON Open Data Maturity Model (ODMM).
-
U.S. Energy Information Administration (EIA) — global CO2 emissions from energy consumption
Legal L4 U.S. Government publications are in the public domain. The EIA explicitly permits use and distribution of all data, files, databases, reports, and graphs from its website, with attribution requested as a courtesy but not legally required — L4.
Technical T3 Data is available via the EIA Open Data API (JSON) with stable series IDs, as well as bulk downloads and structured tables. The API requires a free registration key, which prevents a strict T4 classification. Rated T3. Note: this rating reflects the EIA publisher in general; the exact series used on the poster has not been pinned down.
-
U.S. Environmental Protection Agency (EPA) — greenhouse gas emissions data
Legal L4 EPA materials are U.S. Government works and public domain by default. Use and distribution require no permission, though EPA notes that data from non-EPA sources embedded in its publications may carry separate restrictions — L4 at the EPA publisher level.
Technical T2 As cited on the poster, the statistic (fossil CO2 as a share of total GHG emissions) appears to come from a high-level report figure rather than a specific machine-readable dataset. The U.S. GHG Inventory is available in structured CSV form (which would be T3), but the exact underlying dataset cannot be confirmed from the poster alone — rated T2 pending verification.
-
San Francisco Municipal Transportation Agency (SFMTA)
Legal L2 The poster does not specify which SFMTA dataset was used, and the legal rating depends entirely on the source. The SFMTA GTFS transit feed is published under a custom revocable licence that restricts reuse — L2. Data published via DataSF carries a Public Domain Dedication and would be L4. Without knowing the exact dataset, the more conservative L2 applies.
Technical T3 Structured transit feeds and DataSF exports are typically available as downloadable files in standard formats (GTFS, CSV) — rated T3. The exact dataset and endpoint have not been confirmed from the poster alone.
-
People for Bikes (Bike Belongs) — U.S. bike share program inventory
Legal L1 The cited material is a webpage on an advocacy organisation's site with no explicit open data licence or terms of reuse stated. In the absence of clear permission, ODMM defaults to L1 (any restriction or absence of clarity).
Technical T1 Content was rendered as a webpage with no structured data export, download, or machine-readable format available at the time of publication — rated T1.
Tools Used
- Adobe Illustrator